⬤ Silver has been trending higher on the monthly timeframe and is now approaching a major technical zone around $111.58. This target represents the 2.618 Fibonacci extension of the measured move from Silver's 2011 peak through its 2020 low. After breaking out of a years-long consolidation, Silver has steadily climbed through multiple resistance levels, confirming a pattern of higher highs and higher lows that's brought it within striking distance of this projection.
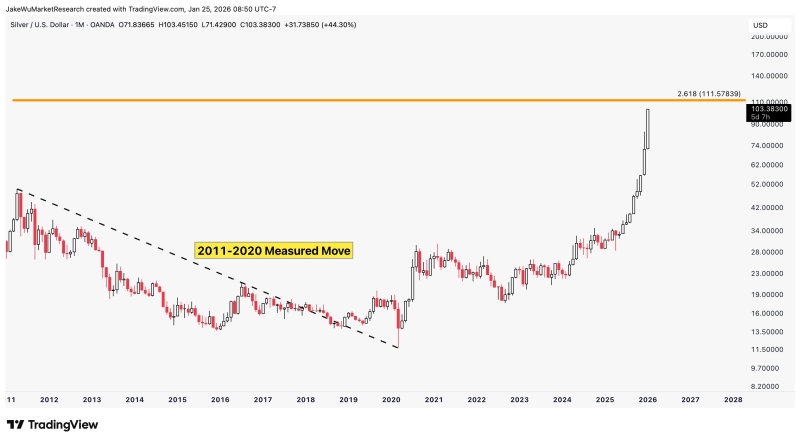
⬤ The chart pattern traces back to 2011, when Silver topped out before entering a prolonged decline and base-building phase that lasted until 2020. Since bottoming in 2020, Silver has mounted a sustained recovery that eventually shifted into a strong uptrend. Recent price action shows continued upside momentum, with Silver now trading well above previous structural resistance areas. "Silver is nearing the 2.618 extension of the 2011–2020 measured move, located around $111.58," highlighting just how close the metal is to completing this technical setup.
⬤ The $111.58 level stands out as the next major upside reference point based on the full scope of the 2011–2020 price decline. While there's no sign of an immediate reversal in the chart, this zone typically draws heightened attention because of how much ground Silver has already covered to reach it. Historical extensions at this magnitude often mark areas where traders reassess positioning and watch closely for momentum shifts.
⬤ What makes this move particularly noteworthy is Silver's dual role as both an industrial commodity and a monetary asset. If Silver sustains its advance toward $111, it would represent a substantial repricing compared to previous cycles and could ripple across commodity markets and investor sentiment more broadly. As the metal trades near this long-term projection, the focus will be on whether it can maintain momentum at these elevated levels or if the measured move extension marks a natural pause point.


