 Nataly Kambur

⬤ Gold has entered a technically sensitive zone as prices push toward the upper edge of a long-term topping channel visible on multi-decade charts. Buying gold near this area carries extremely high risk based on how previous market cycles behaved at similar structural points. The analysis traces gold's price action from the 1970s forward, using Gann angles and horizontal levels to spot areas of overvaluation and major resistance.
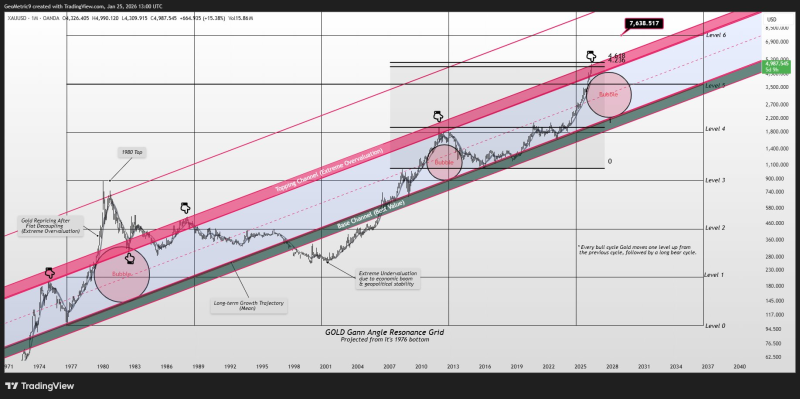
⬤ The chart shows gold's movement within a rising base channel over decades, periodically entering a red-shaded topping zone linked to extreme overvaluation. Past visits to this area matched up with major speculative peaks, most notably the 1980 top. Historical "bubble" phases formed near the upper boundary, highlighting just how significant the current price location is within the broader long-term structure.
⬤ One scenario considers the possibility of an overshoot similar to the 1980s gold rally. If prices break above the topping channel, the horizontal Gann Level 6 near $7,638 stands out as formidable resistance—roughly a 50 percent jump from the current channel zone. According to this framework, even the most explosive bull markets haven't pushed more than two Gann levels in a single cycle.
⬤ This long-term view matters because it puts the current gold rally in historical valuation context rather than just reacting to short-term price moves. The chart also points out that before gold's major breakout in 1980, prices first dropped about 9 percent while still inside the topping channel. That pattern shows how sharp rallies can still face meaningful pullbacks when reaching extreme valuation zones. With gold once again trading near a comparable structural boundary, recognizing these long-term resistance levels becomes crucial—they've historically capped even the strongest bull runs.
 Nataly Kambur


