⬤ The U.S. Dollar Index (DXY) is now testing a critical price zone near 100 that once provided solid support for years but has now turned into a resistance wall. This area lines up perfectly with the Covid volume-weighted average price, making it an even more important technical level to watch. After dropping from its 2024 highs, the dollar is finding it tough to push back above this barrier.
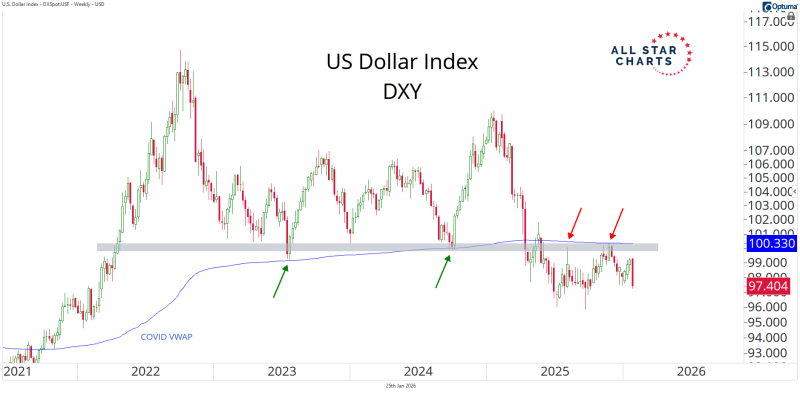
⬤ This price zone has a long history with the dollar. You can see multiple touchpoints on the chart where DXY bounced off this level during pullbacks before eventually breaking down. Now that the index is approaching from below, the dynamics have completely flipped—what used to catch falling prices is now keeping them from rising. The Covid VWAP sitting right here adds extra significance to what's already a meaningful technical junction.
⬤ Recent attempts to break through haven't been successful. Every time DXY pushes toward this resistance band, sellers step in and push it back down. The index is stuck in a tighter range after its recent slide, and traders are clearly watching to see if the dollar can reclaim this ground or if it'll stay capped below.
⬤ What happens here matters beyond just the dollar itself. The DXY's movements ripple through currencies, commodities, and broader risk assets, so this technical battle carries weight across markets. If the resistance holds, it confirms the shift from support to resistance and keeps the dollar on the defensive. But a clean break higher could change the medium-term outlook entirely. Either way, how the index behaves around this level will likely set the tone for dollar positioning in the coming weeks.


