 Nataly Kambur

⬤ EUR/USD demonstrated remarkably similar price behavior during Week 2 and Week 3, showing that short-term patterns can repeat when market conditions stay consistent. Both weeks kicked off with Monday rallies, followed by brief manipulation phases near local highs, then a slow grind downward toward the Weekly DOL. The 60-minute chart clearly shows this symmetry, with both weeks displaying nearly identical price sequencing despite different calendar dates.
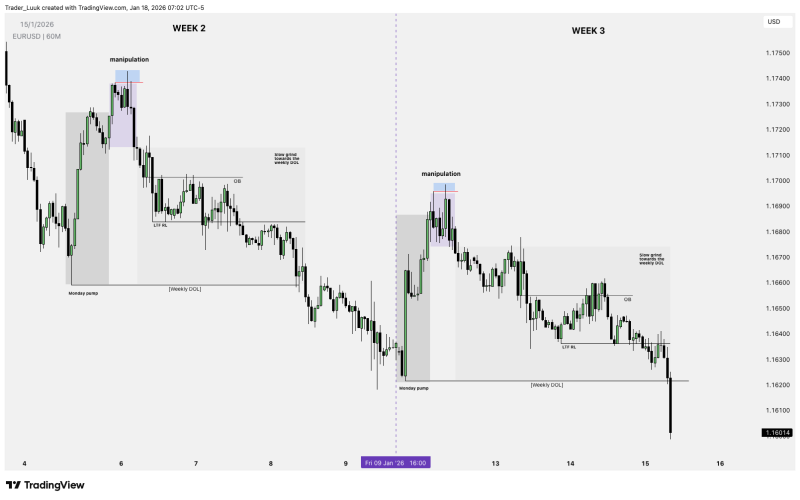
⬤ In Week 2, EUR/USD pushed higher early on before entering a manipulation zone where price briefly extended above previous highs and stalled out. This was followed by a steady, controlled decline that respected intraday order blocks and lower-timeframe range levels. Price methodically worked its way toward the Weekly DOL in a measured directional move rather than a sharp selloff.
⬤ Week 3 followed a nearly identical playbook. EUR/USD rallied Monday, formed a manipulation structure near the highs, then transitioned into another slow downward move. Price respected similar technical references including lower-timeframe range lows and intraday order blocks before continuing toward the Weekly DOL.
⬤ This recurring pattern matters because it shows how short-term price action can repeat when underlying market conditions remain stable. Spotting these structures early in the week lets traders anticipate potential price paths instead of just reacting after the fact. The similarity between these two weeks highlights how contextual awareness and recognizing liquidity-driven patterns can help explain price development as the trading week unfolds.
 Nataly Kambur


