
⬤ EUR/USD has steadied after a long slide down, and the price action now hints at a possible corrective phase starting. The pair reached an extreme zone measured from the December 24 peak around 1.1595, which could open the door for a three-wave rally. The Elliott Wave chart on the daily timeframe shows how this bounce might play out technically.
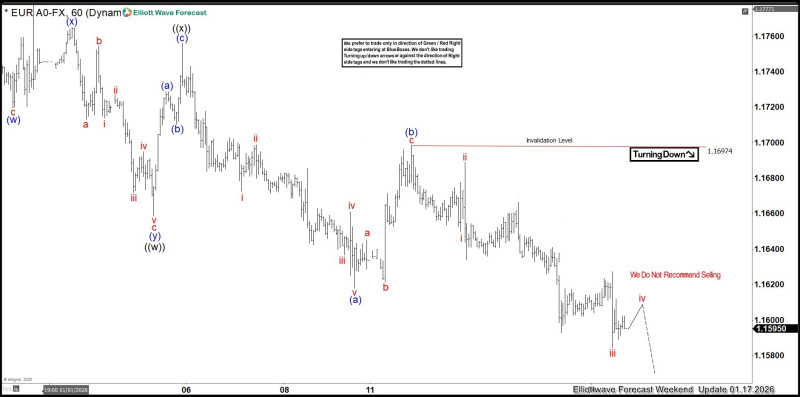
⬤ The chart tracks EUR/USD's fall from above 1.17 down to the 1.1595 area, where selling pressure seems to have eased. Elliott Wave labels suggest a prior correction finished, with early signs of a counter-trend move appearing. This three-wave pattern—labeled a, b, and c—typically signals a corrective bounce rather than a fresh trend beginning.
⬤ Important technical markers appear on the chart, including an invalidation level near 1.1697. If price stays below this level, the bigger bearish structure remains valid even during a short-term recovery. The chart also notes that selling at current levels isn't favorable, suggesting the recent drop may be temporarily exhausted after reaching the extreme zone.
⬤ This setup matters for currency markets because EUR/USD could move into consolidation after sustained weakness. A three-wave recovery might shift short-term sentiment and trader positioning while the larger trend stays unclear. With defined technical boundaries in place, the next price moves will show whether the pair stabilizes further or resumes its broader direction.


