⬤ The NASDAQ versus Russell 2000 ratio is showing clear signs of retreat after an impressive run that started back in 2023. Recent weekly charts reveal the NDX/RUT ratio stepping back from its peak, suggesting we might be seeing a real change in which stocks are leading the market. The ratio had been climbing steadily, supported by long-term trend support and key moving averages, but something's shifting now.
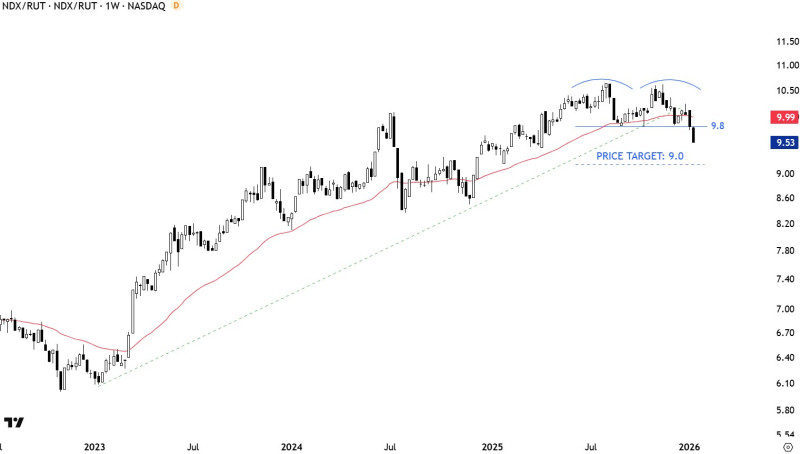
⬤ The recent price action tells an interesting story. After pushing toward 10.5, the ratio couldn't hold those gains and dropped below the 9.8 support level. Now it's hovering around 9.5, which means NASDAQ stocks aren't outperforming the Russell 2000 like they used to. What's particularly notable is the rounded top pattern that formed through mid to late 2025, a classic sign that momentum was running out of steam.
⬤ Technical analysts are now eyeing the 9.0 level as the next important reference point. This zone lines up with previous consolidation areas and sits right at the lower boundary of the upward trend structure. The key moving average that had been holding things up has been broken, confirming that large-cap growth stocks no longer have the clear advantage they once enjoyed.
⬤ Why does this ratio matter? It essentially shows where money is flowing between big tech growth stocks and smaller, more economy-sensitive companies. When this ratio falls, it usually means the market is broadening out rather than being driven by just a handful of mega-cap names. As 2026 unfolds, continued weakness in the NDX/RUT ratio could signal that investors are rethinking their approach to growth, liquidity, and risk across the entire U.S. stock market.


