 Ivan Zhigalov

⬤ The S&P 500 has pushed into overbought territory based on MarketDesk's Technical Composite—a breadth and momentum tracker that's now sitting in a zone historically linked to increased downside risk. The reading suggests the index might be due for a breather or pullback after its latest run-up.
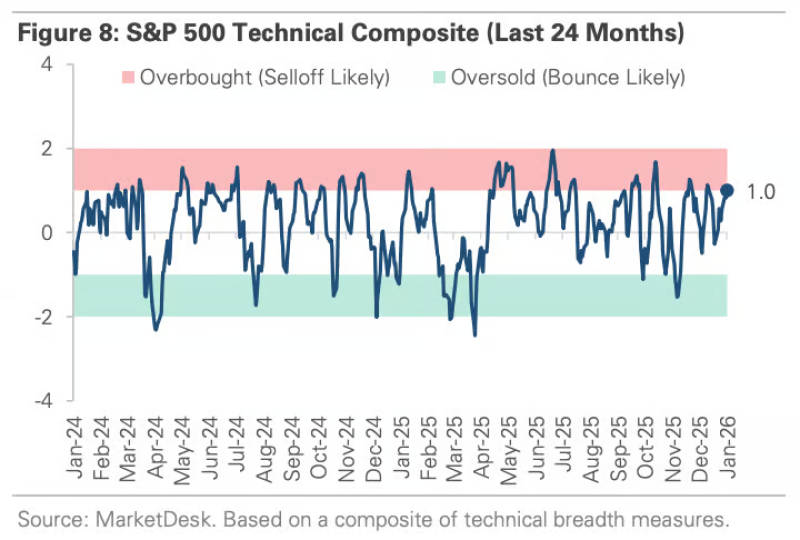
⬤ Looking at the 24-month chart, the composite has been swinging between oversold and overbought extremes, and right now it's firmly planted in overbought range. Past instances when the indicator hit similar levels often led to consolidation or short-term corrections rather than continued rallies. While the S&P 500 has stayed strong lately, history shows these conditions tend to cool things down temporarily.
⬤ MarketDesk's composite doesn't just track price—it pulls together multiple breadth indicators to measure whether buying pressure is getting stretched. When the indicator spends extended time in overbought territory, the odds of a near-term pullback typically increase, even if the bigger trend stays positive.
⬤ This matters because the S&P 500 drives global risk sentiment. When technical readings run this hot, markets become more reactive to economic data, earnings reports, or Federal Reserve signals. If the composite starts drifting back toward neutral, that could signal healthier conditions. But if it stays elevated, expect volatility to pick up in the coming weeks.
 Ivan Zhigalov


