 Yuriy Ukazkin
⬤ Silver's overall trend stays bullish, but it's taking a breather after bumping into resistance at a weak high. The 1-hour XAG/USD chart shows price couldn't hold above recent peaks, leading to a controlled pullback. This reaction hints that the market might hunt for downside liquidity before making its next real move.
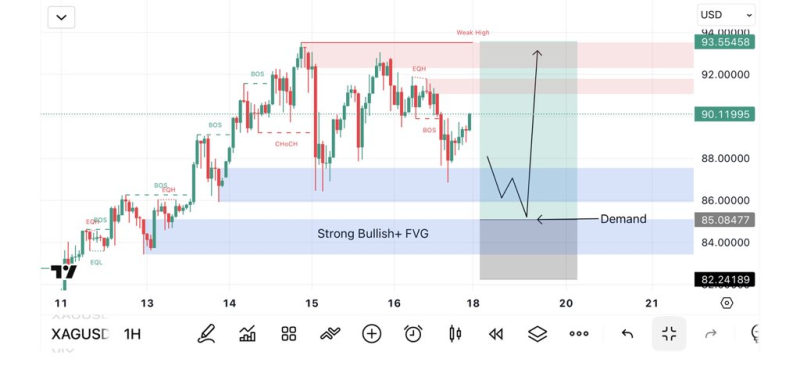
⬤ Earlier price action painted a clearly bullish picture—higher highs, higher lows, and clean breaks through key levels. But recent candles show rejection near the weak high, meaning sellers stepped in temporarily. This lines up perfectly with the supply zone marked on the chart, suggesting we're seeing a normal correction rather than any major trend change.
⬤ Below current levels sits a solid demand zone that overlaps with a fair value gap—basically a magnet for price. The chart's projected path suggests silver could dip into this demand area to grab liquidity before bouncing back up. If the bigger bullish structure holds, we could see price targeting the $91 and $94 levels shown on the chart.
⬤ This setup's worth watching because pullbacks into demand zones often help reset momentum without killing the trend. For silver, a measured drop to sweep liquidity could actually strengthen the bullish case rather than weaken it. How price behaves around these key demand and supply zones will likely decide when—and how strong—silver's next leg up actually is.
 Yuriy Ukazkin


