
⬤ Copper stocks are in freefall. Combined inventories at the London Metal Exchange and Shanghai Futures Exchange have dropped around 60% from their 2024 peaks, and the decline has been steady — not a one-off dip. We're looking at a sustained drawdown that's been grinding through early 2026 with no sign of a bounce.
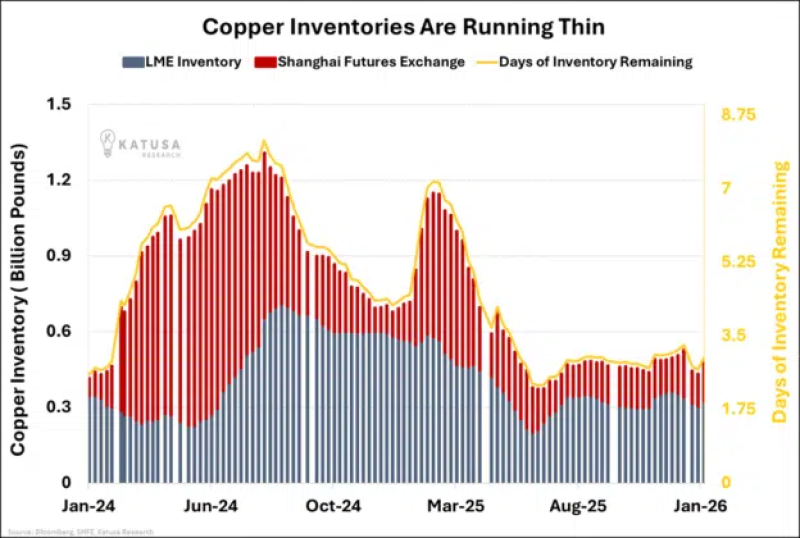
⬤ Here's the thing — copper inventories now cover only about 2 days of global consumption. The long-term average sits around 12 days. That puts current levels nearly 80% below the historical norm. Stocks peaked mid-2024 and have been consistently pulled lower ever since, which tells you this isn't a short-term blip.
When inventory buffers get this thin, even small shifts in production or demand can send prices flying — the market has almost no room to absorb a shock.
⬤ Copper deficits keep building, and warehouses aren't recovering fast enough to keep up. With stocks this low, the market is now hyper-sensitive to any supply disruption. The fact that both Western and Chinese exchanges are seeing the same drawdown pattern makes it clear — this tightness is broad-based, not isolated to one region.
⬤ Why does this matter beyond the copper chart? Copper runs through everything — power grids, EVs, data centers, infrastructure. When stocks drop to these levels, the market loses its shock-absorbing capacity. Persistently low inventories like this typically point to deeper structural stress in commodity supply chains, and that's worth watching closely.


