
⬤ Here's the thing — natural gas markets are flashing warning signs after weekend weather forecasts took a bearish turn. The latest outlook for February 11 through February 15 now shows Gas-Weighted Degree Days falling well below the five-year average. The charts back this up, with forecast GWDDs dipping steadily across that window and tracking meaningfully under seasonal norms.
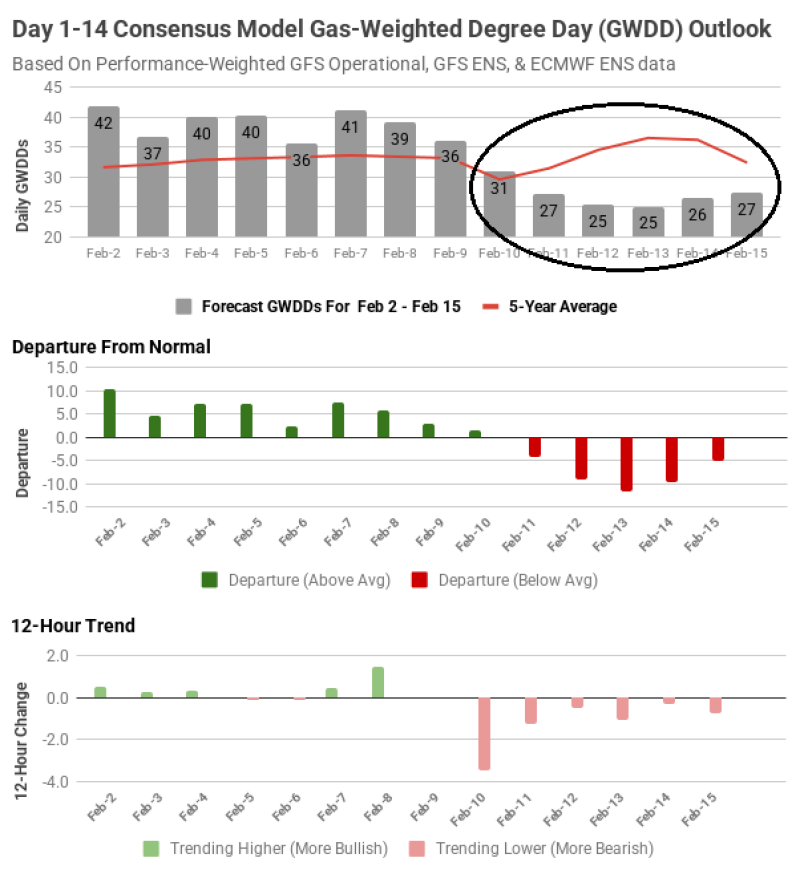
⬤ So what does that actually mean in numbers? Daily GWDDs are expected to ease into the mid-to-high 20s during that stretch — a pretty sharp drop from the upper 30s and low 40s we saw in early February. The departure-from-normal data tells the same story: negative deviations are piling up as the period moves forward, which basically means softer heating demand compared to what's typical for this time of year.
⬤ Model revisions have been consistently pointing lower, too. The 12-hour trend data shows back-to-back bearish updates heading into mid-February, with GWDD forecasts being cut across multiple runs. That's not a blip — it's a pattern. Newer data keeps reinforcing the cooler outlook rather than pushing back against it, and that's already weighing on prices.
⬤ Why should traders care? Winter is when natural gas demand lives and dies on short-term weather swings. Even a few days of below-average GWDDs can flip market sentiment fast, especially right in the middle of heating season. As forecasts keep evolving, that mid-February window is set to stay one of the biggest near-term price drivers for natural gas.


