 Alex Bobrov

⬤ Gold had a rough week. XAU is sitting around$4,865after falling9–10%from its prior close near$5,373. At its lowest point on January 30, the price dipped all the way down to roughly $4,670— a pretty brutal intraday swing. The weekly chart makes it clear: this isn't a minor wobble, it's a real reversal after gold hit fresh record highs.
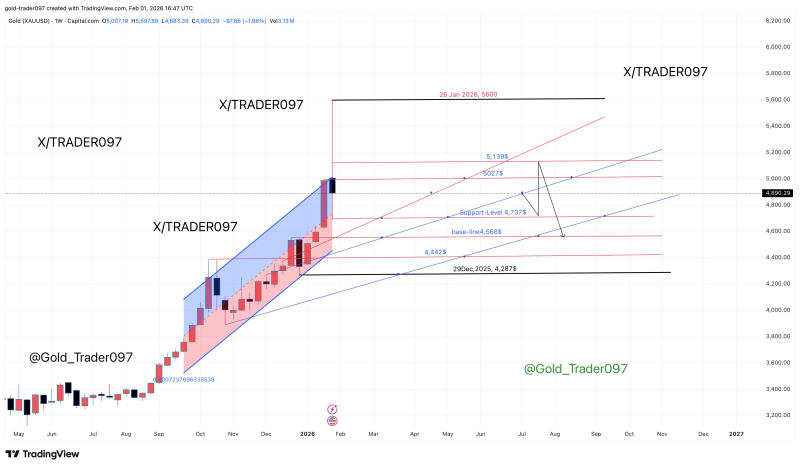
⬤ Before this pullback, gold had been on a tear. Over three months, XAU/USD climbed from around$4,665on January 20 all the way to a record high above$5,596on January 28 — that's a serious move. The rally played out neatly inside a rising channel, but once gold hit the upper boundary, momentum just dried up. The latest weekly candle tells the story: sky-high volatility and sellers taking control."
⬤ Here's where the key levels stack up after the drop. On the upside, watch$4,970–$5,000as the first real resistance — that zone used to be support before things fell apart. Above that,$5,100–$5,140and$5,200–$5,300are the next hurdles, with prior highs sitting around$5,520–$5,615. For support, the immediate demand zone is$4,790–$4,810, followed by the January 30 low near$4,683and a broader floor in the$4,500–$4,540region.
⬤ This correction matters because gold doesn't usually shoot up to record highs and then reverse this fast. When that kind of thing happens, it shifts how the market behaves in the short term — traders get more cautious, and price action around key levels gets tighter. Right now, XAU is consolidating after the selloff, so the next big move will depend on whether buyers can hold current levels or if we see another leg down.
 Alex Bobrov


