
⬤ USD/JPY reversed sharply and dropped back to a well-established support area after repeatedly failing to push past the 155 resistance level. The 155 zone has held firm so far, blocking any meaningful upward movement. The hourly chart shows a strong bearish wave starting from the 158 area, followed by accelerated selling that drove the pair back toward previous support levels.
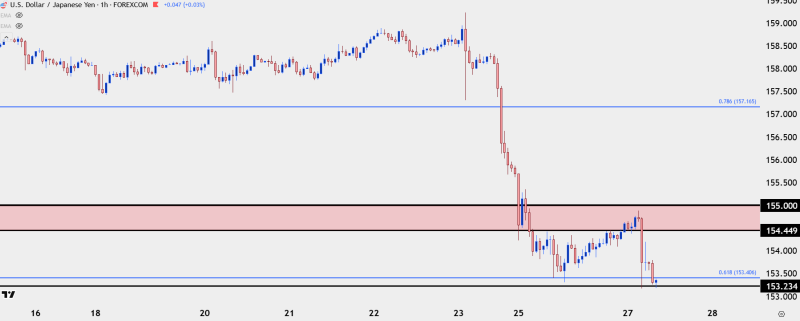
⬤ The chart reveals USD/JPY broke through intraday support levels before settling into a broader demand zone between roughly 154.40 and 155.00. This zone had served as a consolidation area before, making it more significant now that price has returned. Fibonacci retracement levels confirm the move—price dropped below the 0.786 level near 157.16 and pushed toward the 0.618 level around 153.40. The quick, decisive nature of the decline points to strong selling rather than a gentle correction.
⬤ After hitting the lower edge of the support zone, price action started to stabilize with smaller candles forming near the lows. This shows hesitation after the sharp drop rather than a confirmed bounce. The short-term picture still shows lower highs since the rejection above 158, and the pair's inability to reclaim 155 continues to limit recovery attempts. Any move back toward that level could face fresh selling unless momentum changes significantly.
⬤ This move matters because it highlights how important the 155 level has become as a major technical barrier. The clear rejection at resistance followed by a swift return to support shows a shift in near-term momentum. How the pair behaves around this support zone will likely shape short-term direction—whether it stabilizes here or breaks lower could influence sentiment across other yen pairs as well.


