 Alex Borzak

⬤ The US Dollar Index just broke through a major support level that's been holding up the currency for 18 years. DXY futures crashed through a rising trendline that's been defining the dollar's path since the late 2000s. The weekly chart shows price slipping below this crucial line around the 96 mark after testing it repeatedly in recent years.
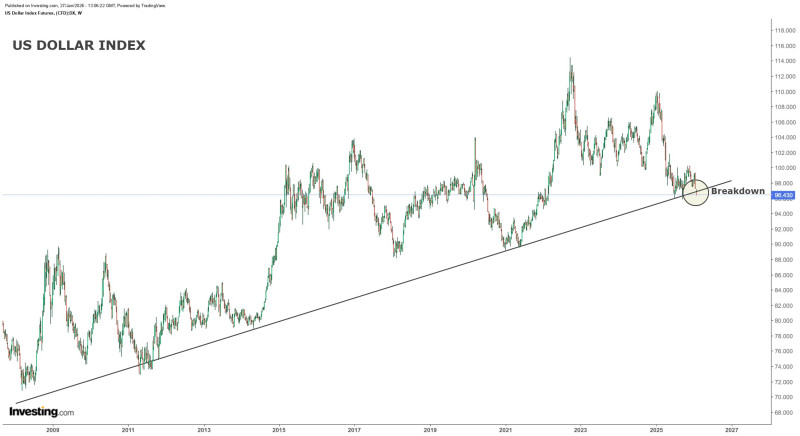
⬤ Looking at the bigger picture, the dollar's been climbing steadily from its 2008 crash lows, making higher lows all through the 2010s and into the pandemic era. It peaked above 114 back in 2022, then started coming back down. Instead of bouncing back up like it used to, it just kept sliding toward that long-term trendline and finally broke right through it.
⬤ The breakdown happened after months of the index hanging around that support line—a pattern that usually leads to bigger moves once support finally gives way. The chart clearly marks where it broke down, with DXY now trading underneath that former safety zone around 96. This level used to be a big deal during past market cycles, and losing it changes everything about the dollar's technical setup.
⬤ This matters way beyond just currency traders. The dollar index drives pricing across pretty much everything—other currencies, commodities, you name it. If this breakdown sticks, we could see money flowing differently across global markets and major shifts in which assets look strong. We'll need a few more weeks to confirm this isn't just a fake-out, but breaking an 18-year support level definitely changes the game for where the dollar's headed long-term.
 Alex Borzak


