
⬤ WTI crude is making waves after holding a support level that's stayed rock-solid for about 40 years when you adjust for money supply. The chart right now looks eerily similar to a head-and-shoulders pattern we saw back in the early 2000s—and we all know what happened next.
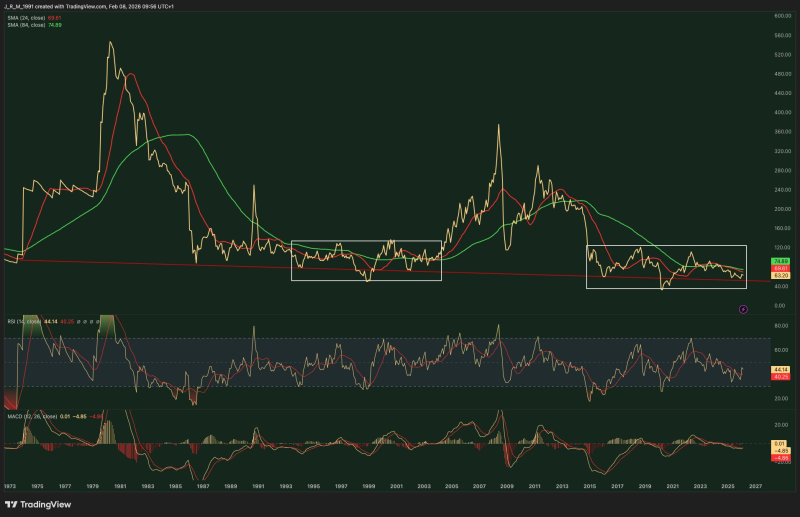
⬤ This isn't the first time oil has bounced off this real-price support zone. It's happened repeatedly over the decades, and the last time we saw a similar setup was right before the 2000s oil boom. Instead of crashing through that floor, prices are stabilizing there, just like they did before the last major rally.
⬤ WTI crude oil market structure suggests the asymmetry traders are watching isn't about calling tops or bottoms—it's about recognizing when the potential reward outweighs the risk. Momentum indicators are sitting in neutral territory, typical behavior during long consolidation phases before a breakout rather than during trending markets.
⬤ Why does this matter? Because when oil hits these major structural levels, it's historically marked the beginning of massive commodity cycles. The market is once again parked at a zone where past multi-year trends were born, and the commodity cycles and market context shows similar pressure building across energy markets.
⬤ Oil traders know that inflation-adjusted charts strip away the noise and show you the real purchasing power behind price action. That 40-year support isn't just a line on a chart—it's a psychological and fundamental level that's held through recessions, wars, and market crashes. If it breaks, it would be historic. If it holds and reverses like it did in the 2000s, we could be looking at the start of another extended bull cycle.
The current setup offers what traders call positive asymmetry: limited downside against substantial upside potential if history decides to rhyme once again.


