⬤ The US100 Nasdaq index is making a tentative effort to stabilize around the 25,200 level on the hourly chart after a sharp selloff. The recent bounce appears to be more of a reaction buy than any meaningful shift in trend direction. Price has lifted slightly from lower levels but stays locked within a clear downward structure.
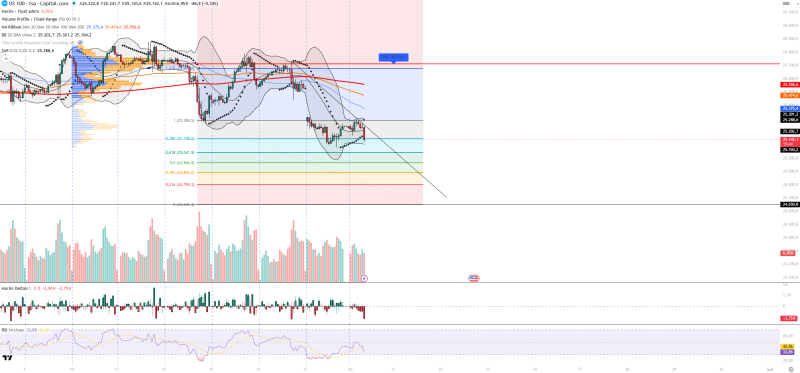
⬤ Technical signals point to continued selling dominance. Candles are forming with small bodies, showing weak buying conviction and uncertainty near resistance zones. Price remains trapped below key moving averages and descending trendlines that keep capping any upside attempts. Volume readings are muted, indicating the rebound lacks real commitment, while Volume Delta stays negative—confirming sellers are still in control.
⬤ Momentum indicators paint a cautious picture. The RSI sits near 33, close to oversold but not yet signaling a real reversal. Bollinger Bands show price hugging the lower band, which can trigger short-term bounces but doesn't guarantee a trend change. Parabolic SAR dots remain positioned above price, reinforcing the downward bias. Volume Profile highlights 25,713 as a key equilibrium point that price hasn't been able to reclaim.
⬤ This setup matters for broader market sentiment since US tech stocks often drive risk appetite across equities. Ongoing weakness paired with thin participation and persistent selling pressure could fuel short-term volatility. Support sits near 25,100, 24,950, and 24,800, while resistance clusters between 25,300 and 25,750. How price reacts around these levels will likely determine whether stabilization takes hold or the decline continues.


