 Alex Bobrov

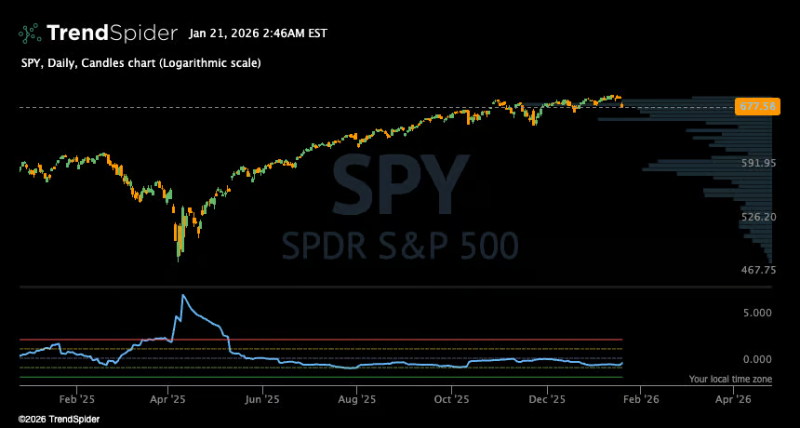
⬤ SPY's consolidating near recent highs around the 577 level after a modest selloff, and here's what stands out: volatility's barely budged. The daily log chart shows price action flattening rather than accelerating downward. When markets really break down, you typically see volatility explode—but that's not happening here. This pullback lacks the panic-driven intensity that marks genuine corrections.
⬤ The current market behavior doesn't match what happens at the start of major declines. Historically, meaningful corrections come with expanding volatility and sharp downside momentum. Instead, SPY's holding a narrow range while volatility indicators stay compressed. This suggests the recent weakness is more about temporary pressure than any fundamental shift in market structure.
⬤ Price hasn't broken decisively below key support zones, and the broader uptrend remains intact. There's no sustained follow-through to the downside—which reinforces the idea that we're seeing a pause rather than a reversal. The chart pattern looks more like consolidation within an ongoing advance than the beginning of something worse.
⬤ This matters because SPY's a critical gauge of equity sentiment and risk appetite. When volatility stays low during a pullback, it shapes how traders interpret near-term risk—reinforcing stability expectations rather than disorder. If this pattern holds, the recent pause could simply be part of the continuing advance rather than signaling deeper trouble ahead.
 Alex Bobrov


