 Ivan Zhigalov

⬤ The S&P 500, tracked through SPY, is nearing nine consecutive months of gains, putting this rally among the rarest momentum runs in the past 20 years. Extended winning streaks like this are the exception, not the rule. The monthly returns heatmap shows just how persistent this recent strength has been, with SPY approaching a milestone reached only a handful of times since 2006.
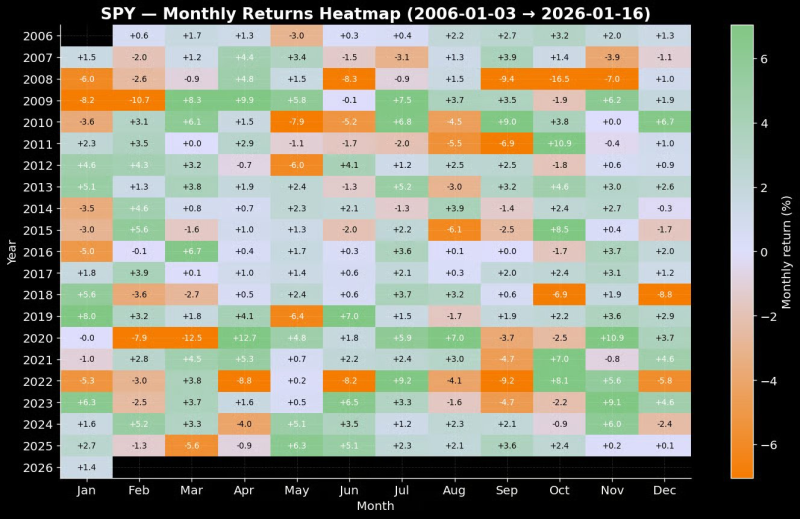
⬤ Looking back through history makes the current stretch even more striking. Over the last two decades, only 2017 delivered a longer bullish sequence of consecutive positive months for SPY. Another comparable run happened in 2006–2007, when the index posted eight green months in a row before things shifted later that year. The heatmap backs this up, showing clusters of strong monthly performance during late-cycle phases that were often followed by increased volatility rather than smooth sailing.
The balance between seasonal support and late-cycle dynamics becomes increasingly relevant as SPY approaches a historically rare ninth consecutive positive month.
⬤ Despite concerns about the rally's age, near-term seasonal trends still look favorable. The January through mid-February window has historically been friendly to SPY dip-buyers. That seasonal tailwind is holding up even as markets digest worries around geopolitics, trade policy shifts, and rising Japanese government bond yields. The heatmap shows that pullbacks during this period have typically been absorbed rather than spiraling into deeper corrections.
⬤ These extended win streaks matter because they shape how traders think about risk. As SPY pushes toward this rare ninth consecutive positive month, the tension between seasonal support and late-cycle warning signs is getting harder to ignore. Whether the index keeps climbing or finally takes a breather will tell us a lot about how durable this momentum really is—and how markets are handling the uncertainty ahead.
 Ivan Zhigalov


