 Nataly Kambur

⬤ Gold showed solid strength on the hourly chart after a brief pullback during Asian hours, but the $4,660 level held firm. Price stayed above last week's trading range ceiling, which allowed the rally to push from $4,660 toward the $4,690–$4,700 zone. This level became the key support that kept the uptrend alive and price action moving within the rising channel.
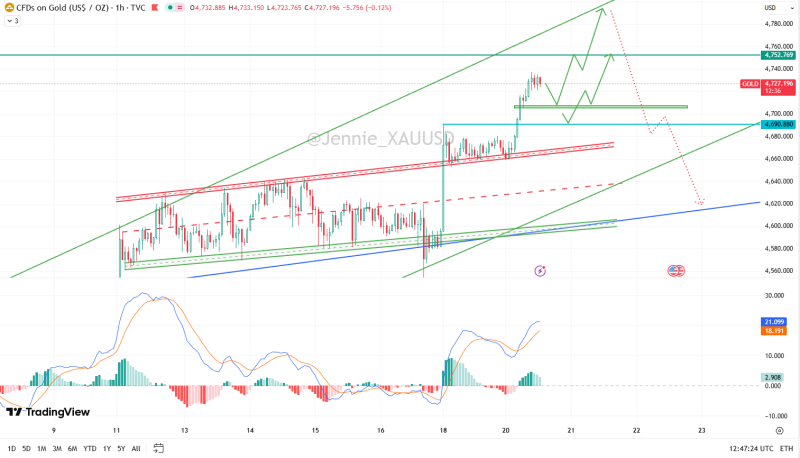
⬤ When European markets opened, XAU/USD tested resistance near $4,718 before dipping slightly to around $4,705. But here's the thing—that pullback was shallow and quickly bought up, keeping price near recent highs. The limited downside during European trading shows buyers are still in control and hints at another potential push higher during the US session.
⬤ In healthy uptrends, pullbacks usually stop around the 38.2% Fibonacci level, though choppier conditions can see moves down to 61.8%. On the hourly chart, these zones line up with $4,707–$4,705 and the broader $4,690 support area. These levels also match up with the European session low, the middle Bollinger Band, and short-term moving averages. If price dips into this zone during US hours and holds, the upside stays intact with resistance targets at $4,745–$4,750 and then $4,765.
⬤ If price hits resistance without testing support first, watch how it behaves on the next pullback. The chart shows some short-term volume divergence, and the daily structure suggests we might be entering a high-level consolidation phase. That kind of setup can produce choppy swings—sharp rallies followed by quick drops—which often signals shakeout action before gold picks its next real direction.
 Nataly Kambur


