
⬤ Crude oil is stuck in a clear downtrend on the weekly chart, and the sellers are firmly in control. Right now, global oil supply is running ahead of demand, which has been pushing prices lower. USOIL is trading in the upper $50s after failing to climb back above previous support zones that used to hold the market up.
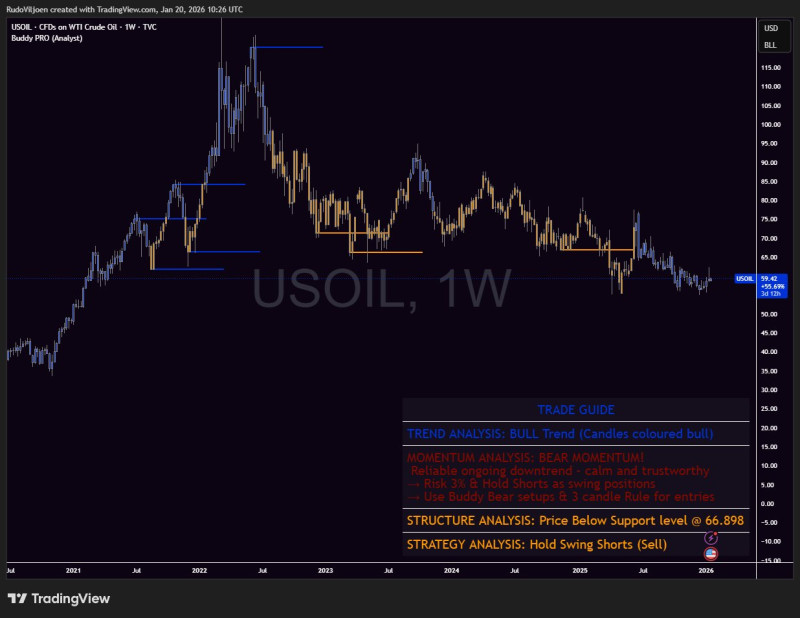
⬤ Looking at the technicals, oil has been sliding steadily since it topped out above $100. The chart shows a textbook bearish pattern with lower highs and lower lows stacking up over time. What used to be support has now turned into resistance, making it tough for buyers to gain any traction. The breakdown below $66.90 was a major red flag that confirmed the bears are running the show.
⬤ "The projected downside target remains near $56, which is identified as a realistic swing objective within the current trend," highlighting where oil could be headed if the selling pressure continues.
⬤ The $56 level is the next logical target based on the current momentum. Traders watching this setup are staying bearish as long as price holds below key resistance levels. That said, there's some short-term uncertainty tied to US-China tensions. China still needs energy, and if the US moves to restrict access, it could put a temporary floor under prices or at least slow the decline.
⬤ This matters beyond just oil traders. Energy prices directly impact inflation, consumer costs, and overall market sentiment. If crude keeps dropping toward $56, it confirms that supply is overwhelming demand. Any bounce driven by geopolitical drama would likely be temporary rather than a real trend change. The next few weeks will show whether oil continues its slide or catches a break from external factors.


