 Yuriy Ukazkin

⬤ West Texas Intermediate is sitting on what could be the energy market's next big powder keg. The long-term charts are showing a textbook compression pattern—the kind that usually doesn't stay quiet forever. According to technical analysis breaking down the logarithmic structure, crude oil is methodically building toward what might become a monster move into the $250 zone, though it's all about timing and whether key levels finally crack.
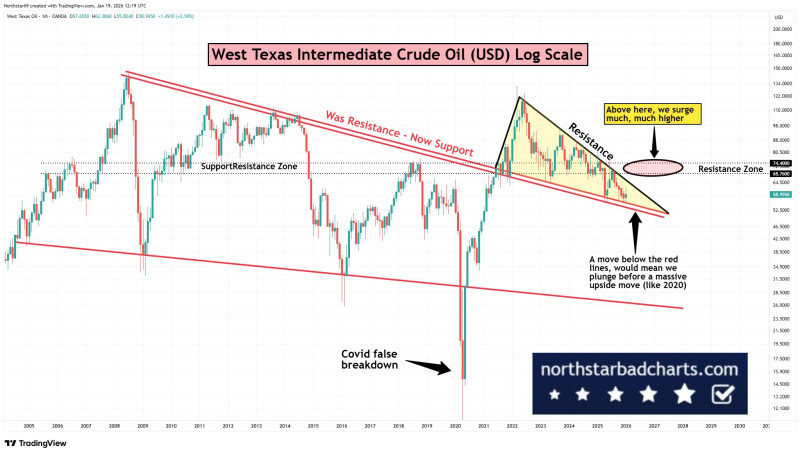
⬤ Right now, WTI is bumping its head against resistance around the mid-$70s, a level that flipped from old support to new ceiling after the 2020 crash and recovery. The price is getting squeezed between converging trendlines—higher lows meeting lower highs—creating that classic coiled spring effect traders watch for. Instead of trending cleanly in either direction, oil's been stuck in this holding pattern, basically consolidating and waiting for its next major catalyst.
⬤ Here's where it gets interesting: those resistance levels aren't just random lines on a chart—they've been calling the shots for years. "This setup is significant for the broader energy market because WTI crude oil prices influence inflation expectations, energy costs, and global economic sentiment," and breaking above that $70s ceiling could unlock a much bigger upside trajectory. But there's a flip side too—if price breaks down below the lower support trendlines instead, we might see a sharp drop before any major rally materializes.
⬤ Why should anyone outside the trading world care? Because when crude oil spends years building pressure like this, what happens next ripples through everything—gas prices, inflation data, central bank decisions, you name it. These extended compression phases typically explode into big directional moves eventually, making oil extremely sensitive to geopolitical shocks or economic shifts right now. The longer this range tightens, the bigger the eventual breakout could be.
 Yuriy Ukazkin


