 Alex Bobrov

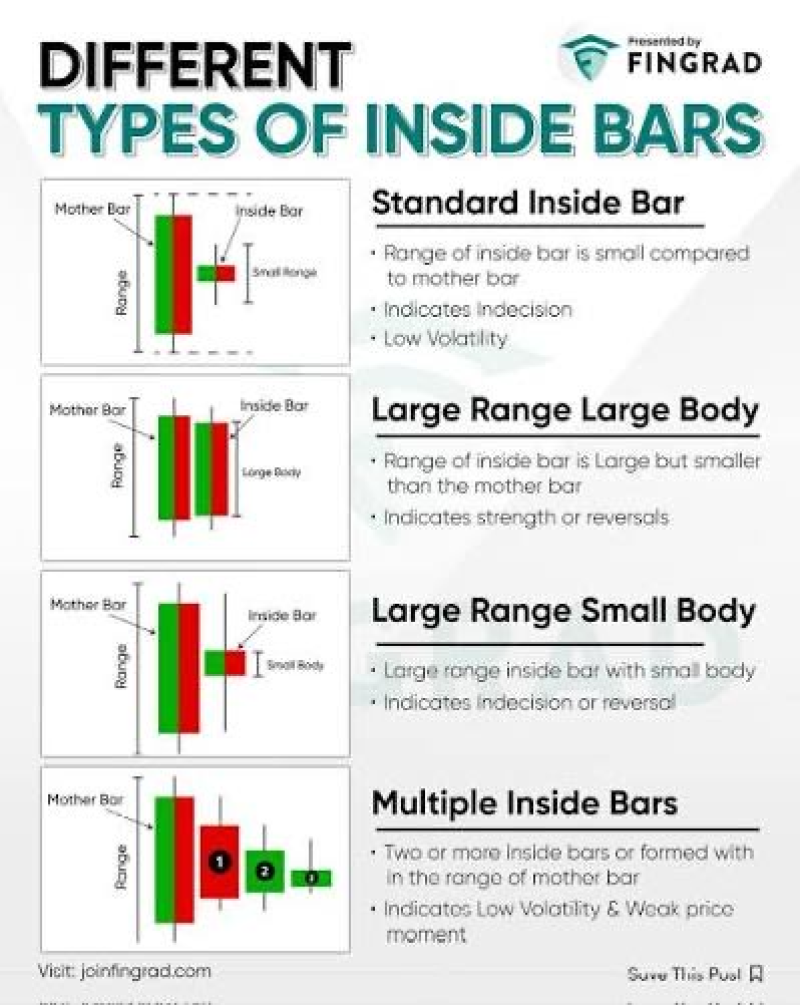
⬤ Natural gas is trading sideways near recent highs, with the daily chart showing a tight compression pattern instead of any real follow-through. NATGAS just printed another inside range candle, stacking on top of the previous session's inside bar and Wednesday's spinning top. This cluster of small-range candles shows clear consolidation and indecision, with price stuck near the upper end of its recent rally rather than pulling back.
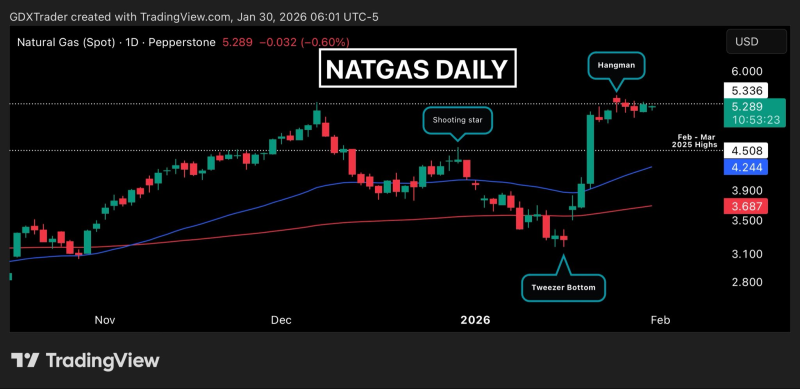
⬤ The chart shows NATGAS rallied hard into late January before stalling just below recent highs, and that's where it's been sitting ever since. Even though there was a hangman candle earlier in the move that raised some short-term concern, there's been no decisive close below prior session lows. That lack of downside follow-through tells you sellers haven't been able to take control, while buyers keep defending the upper range and holding price elevated.
This behavior is consistent with a developing bullish pennant structure, where volatility contracts as the market digests gains.
⬤ The sequence of inside bars shows declining range and fading momentum, which is pretty typical during consolidation phases. On lower timeframes, there's a well-defined symmetrical triangle forming on the hourly chart, which backs up the idea that price is coiling rather than trending. A clean break of this structure should trigger the next directional move.
⬤ This setup matters for the broader natural gas market because when price consolidates near highs for this long, it usually reflects strong underlying demand. When price holds near the upper range instead of retracing, it means bullish momentum hasn't fully died out. At the same time, extended compression like this increases the odds of a volatility spike once the range finally breaks. How NATGAS resolves this tightening structure will likely define near-term direction and set the tone for what comes next.
 Alex Bobrov


