
⬤ Natural gas prices pushed higher this week after breaking out from a bull flag pattern, marking a clear shift in short-term momentum. The daily chart showed NATGAS consolidating in a narrow range near recent highs following a strong rally. After days of compression and indecision, price finally resolved to the upside, confirming buyers had regained control.
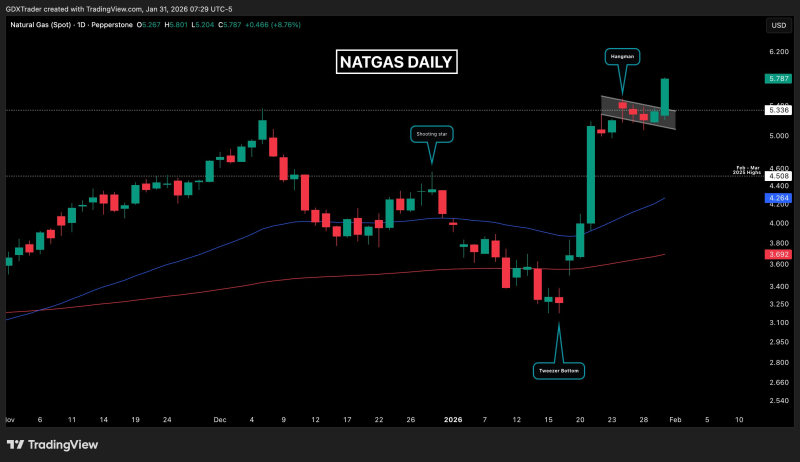
⬤ Early in the week, a hangman candle raised some concerns about a potential short-term reversal. However, bears couldn't follow through—no session closed below the prior day's low. Instead, price formed spinning tops and inside bars, showing balance rather than selling pressure. This action kept the bullish flag structure intact rather than triggering a downside break.
The expansion in range and follow-through buying resolved the consolidation higher, confirming that buyers had reasserted control.
⬤ Friday's session confirmed the breakout with a strong bullish candle that pushed cleanly above the flag's upper boundary. The move came with solid follow-through and expanding range, validating the pattern. Price held above key support levels and moving averages throughout the consolidation, which added credibility to the upside resolution.
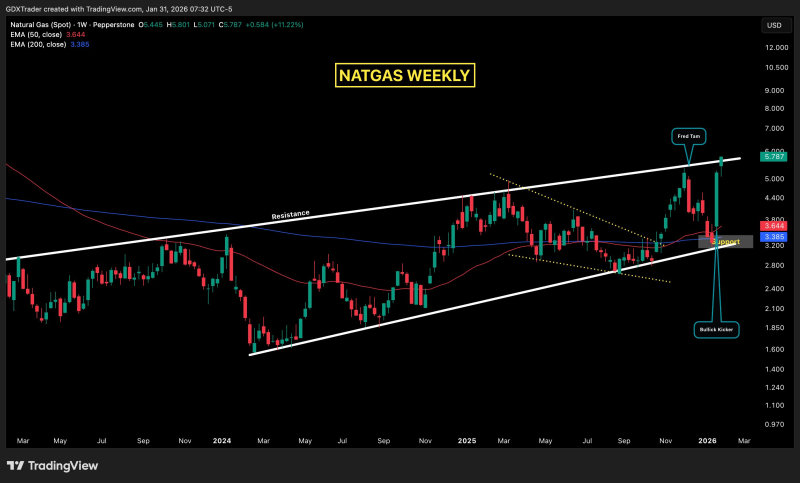
⬤ The weekly chart adds another layer of confirmation, with natural gas now testing the upper boundary of an ascending channel. This alignment between daily breakout and weekly resistance suggests the move is part of a broader trend continuation rather than just a short-term spike. When both timeframes confirm the same direction, it typically carries more weight.
⬤ Natural gas tends to make sharp directional moves after extended consolidation periods. When compression resolves with confirmation across multiple timeframes, it often influences volatility and positioning across energy markets. The current setup shows momentum and price action have both shifted toward continuation after a week of balance between buyers and sellers.


