 Yuriy Ukazkin
⬤ Silver has found its footing after tumbling from recent peaks above 120, as the daily Capital.com chart reveals. The metal reversed course dramatically and slid into the mid-80s—a substantial correction by any measure. What's notable now is that recent candles show the selling pressure has backed off considerably compared to the initial plunge.
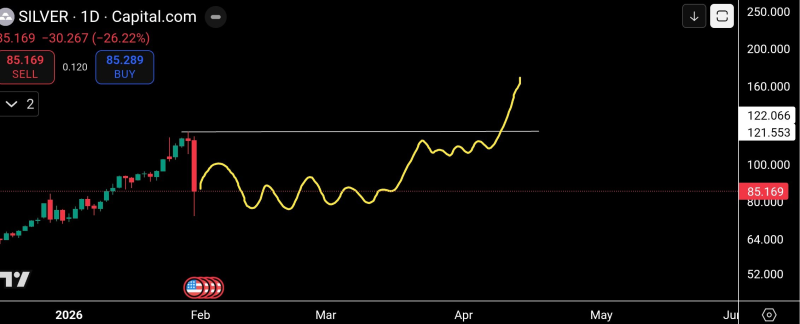
⬤ The preferred outlook calls for silver to grind sideways for several months before building up enough steam for another leg higher. The chart captures this expectation through a projected range-bound pattern, with price staying below the former resistance around 120. This consolidation should give momentum indicators like RSI time to cool down after the strong rally that came before the drop.
⬤ The chart's visual projection maps out a choppy, sideways phase stretching through the next few months, potentially setting up for a fresh move higher if the structure plays out as expected. Throughout this period, the $70–$60 zone stands out as the line in the sand—a support area that needs to hold. Staying above this range would confirm that the recent decline is just a correction, not the start of a full reversal.
⬤ Right now, silver is trading comfortably above that critical support zone, and there's no sign of accelerating downside momentum. Instead, the market looks like it's shifting gears from high volatility into a steadier consolidation mode, where big directional moves give way to oscillation within a defined range.
⬤ This consolidation phase matters because it can reset the market after sharp rallies and corrections. Holding above major support levels could help restore balance across precious metals, while a breakdown below $70–$60 would signal a structural shift and open the door to further downside risk.
 Yuriy Ukazkin


