 Ivan Zhigalov
⬤ Silver is back on the radar for technical traders. The long-term monthly chart tells a compelling story on its own — decades of accumulation, big consolidation phases, and then sharp directional moves. Here's the thing: the focus stays squarely on price action, not macro narratives or valuation debates. The structure speaks for itself.
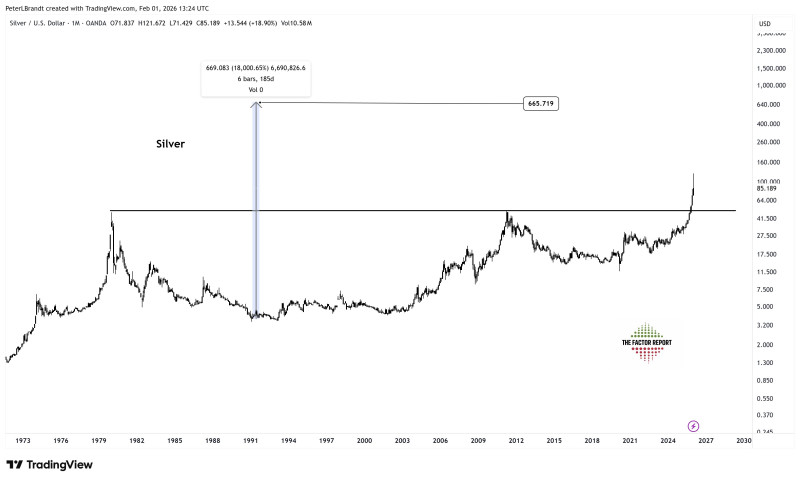
⬤ Right now, Silver is trading above a long-standing horizontal zone that used to act as a major ceiling. That's a significant shift. The chart shows a strong rally off long-term lows, and the move keeps building toward levels we haven't seen in years. But don't expect a straight shot up — the targets are based on proportional expansion from prior ranges, not short-term momentum.
⬤ A move toward $60 is shaping up as a realistic intermediate milestone before any talk of bigger targets. Along the way, expect pauses and pullbacks — that's normal in long-term trends. The big number $600 is a conditional, long-range projection. What actually matters day-to-day is whether price keeps confirming the structure.
⬤ Why does this matter beyond Silver? It sits right at the crossroads of commodity cycles and long-term capital flows. If the structural breakout holds, it's a signal that hard assets are entering a new phase — no external narrative needed. The $600 target is distant and conditional, but the real takeaway is simple: trust the chart, watch the price levels, and let structure lead.
 Ivan Zhigalov


