
⬤ WTI crude oil is doing something interesting on the monthly timeframe right now. After a long stretch of decline, prices have started stabilizing near recent lows — and momentum indicators are quietly ticking up. A regular bullish divergence has formed on the monthly chart, which historically tends to show up right before a corrective phase starts losing steam.
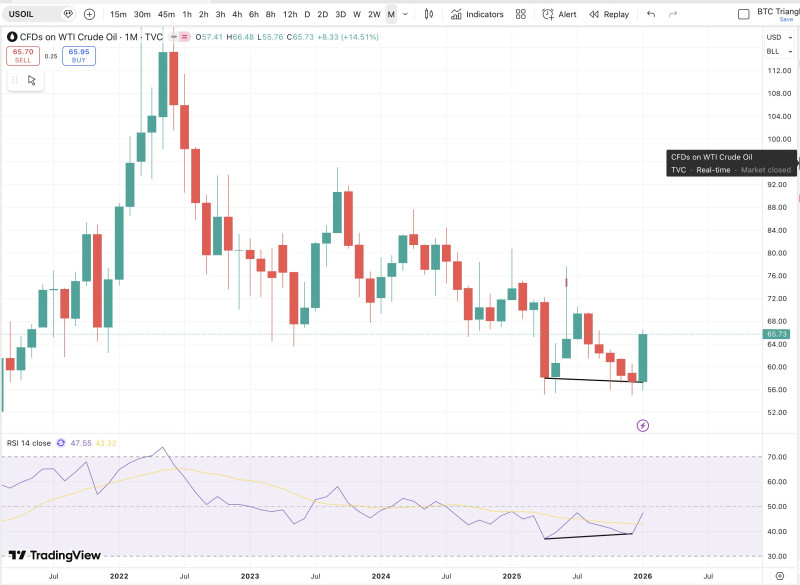
⬤ Here's the thing — while crude oil kept making flat or lower lows over the past few months, the RSI was quietly forming higher lows at the same time. That's a textbook divergence signal. It doesn't mean prices are about to skyrocket overnight, but on a monthly chart, this kind of setup is a pretty reliable early warning that downside momentum is fading fast.
⬤ Price-wise, WTI recently bounced back from some pretty depressed levels after multiple failed attempts to push oil materially lower. Sellers have been trying — and repeatedly failing — to break things down further. On top of that, geopolitical tensions could act as a spark. History shows that once momentum starts shifting, external risk factors tend to amplify the move.

⬤ Why does this matter beyond oil charts? Because crude prices directly feed into inflation expectations and broader risk sentiment. A real recovery here could put upward pressure on energy costs and reshape the macro outlook. The divergence alone isn't a green light for a new bull trend — but it's a strong signal that the risk-reward balance is shifting after a prolonged decline. Oil is definitely worth watching closely in the months ahead.


