 Nataly Kambur

⬤ The U.S. Dollar Index plunged hard in late January, dropping from around 99.50 down to the mid-95s before catching a short-term bounce. The daily chart shows a series of heavy red candles followed by some recovery attempts—classic signs of a volatile market rather than any smooth trend change. This kind of dollar whipsaw usually points to liquidity stress in the system, not a clean shift into risk-on mode.
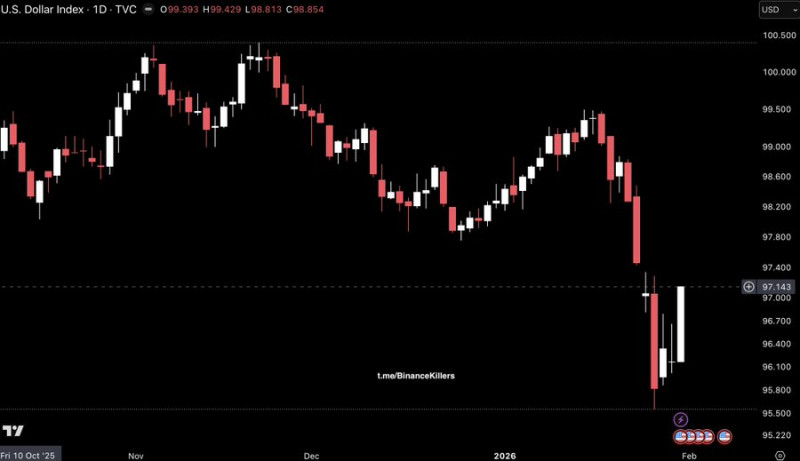
⬤ Technically, DXY couldn't hold the 97.00 level that had been acting as short-term support. The breakdown came fast with barely any pause, showing real selling pressure was behind it. While the index has climbed back toward the 96.80–97.20 zone, it's still sitting well below those recent highs near 99.50. The structure looks shaky and momentum unclear.
⬤ These sharp dollar drops usually hit alongside stress in risk assets like crypto. The chart backs this up—the selloff looks sudden and messy, not controlled. These conditions often squeeze leveraged positions before things settle down, rather than immediately kicking off a sustained rally in riskier assets.
⬤ This matters because DXY remains a key read on global liquidity. When the dollar swings this hard, it ripples through currencies, commodities, and digital assets. Until DXY finds clearer direction, markets will likely stay jumpy and react to every macro shift.
 Nataly Kambur


