 Alex Borzak

⬤ The U.S. Dollar Index (DXY) is back at the bottom of a rising channel that's guided its movement since the 2009 financial crisis. What matters here isn't the short-term dips—it's whether the monthly candle actually closes below this support. So far, despite repeated tests, that hasn't happened.
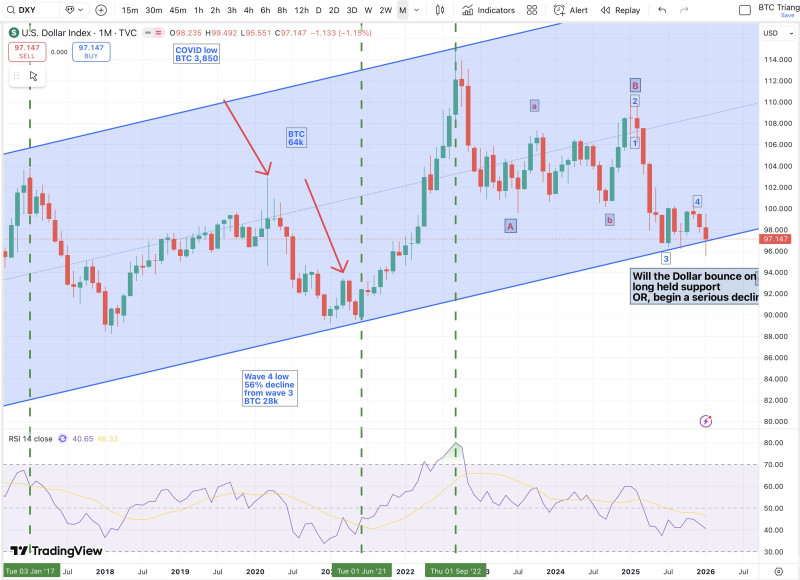
⬤ Looking at the monthly chart, DXY has bounced off this zone through multiple economic cycles and volatility spikes. Yes, the price sometimes drops below during the month, but those moves don't stick. When the candle closes, it's been above support every time. That's what makes this level more than just a line on a chart—it's proven itself over 15+ years.
⬤ Here's where it gets interesting for Bitcoin holders: past tests of this DXY support have lined up with major BTC price shifts. The COVID crash low, cycle transitions, subsequent rallies—they've all happened when the dollar was bouncing around this same channel base. It's not a perfect correlation, but the pattern is hard to ignore.
⬤ Why does this matter right now? Because the dollar basically sets the tone for global money flows. As long as DXY keeps holding above this channel on a closing basis, the long-term uptrend is still intact. A real breakdown—one that closes below and stays there—would be the first time that's happened since 2009. That kind of shift could unlock a different environment for Bitcoin and risk assets entirely.
 Alex Borzak


