 Dmitri Lysenko
⬤ The U.S. Dollar Index is trading around a critical technical zone after weeks of decline, with traders watching whether it can push back above 96.6. The dollar has shown some signs of stabilizing following talk about potential Federal Reserve leadership shifts, though the recovery attempt has been limited so far. The chart shows DXY consolidating just beneath a horizontal level that's acted as an important marker in recent sessions.
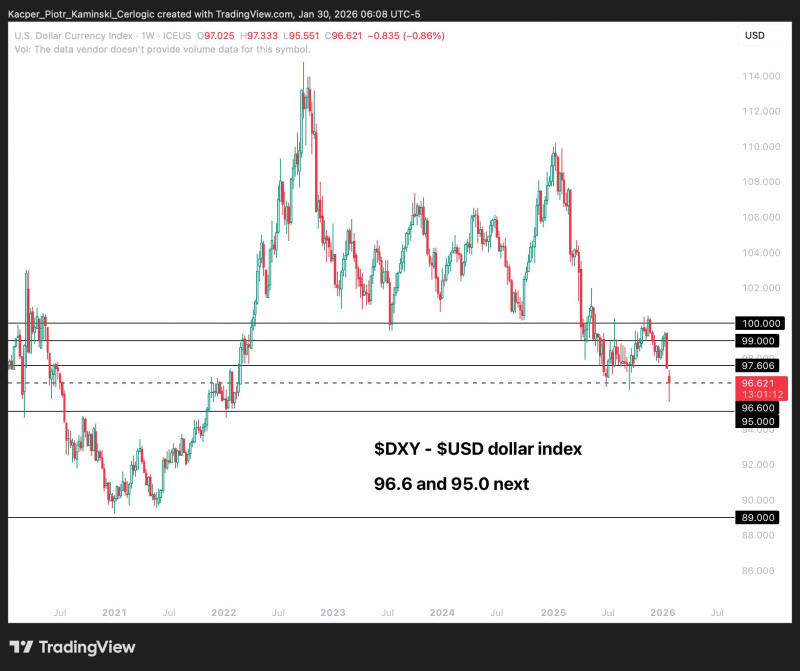
⬤ Looking at the weekly chart, there's a clear downtrend from early 2025 highs near 110, followed by a pattern of lower peaks and troughs. The index has dropped below 97.6 and is now testing the 96.6 area—a zone that previously provided support but now looks like resistance. Price has bounced off this level multiple times, making it a key short-term battleground.
⬤ The chart also identifies the next support zone around 95.0 if current levels don't hold. A solid close above 96.6 would increase the chances of a corrective bounce higher, while failure to reclaim this level keeps the broader bearish structure in play. Right now, price action looks indecisive—neither buyers nor sellers have taken clear control.
⬤ This matters because the dollar index affects everything from major currency pairs to commodities and global risk appetite. How DXY behaves around 96.6 will help determine whether the dollar is building a base for recovery or heading lower. The outcome could shape near-term trends across forex markets as traders figure out if the recent weakness is running out of steam or just getting started.
 Dmitri Lysenko


