 Yuriy Ukazkin

⬤ The U.S. Dollar Index has pushed lower on the 4-hour chart after hitting a downside target that was flagged earlier this month. The bearish move anticipated from January 12 reached the 12.560 mark, completing the initial downside objective. Instead of finding support there, the price kept sliding, showing that sellers are still in control.
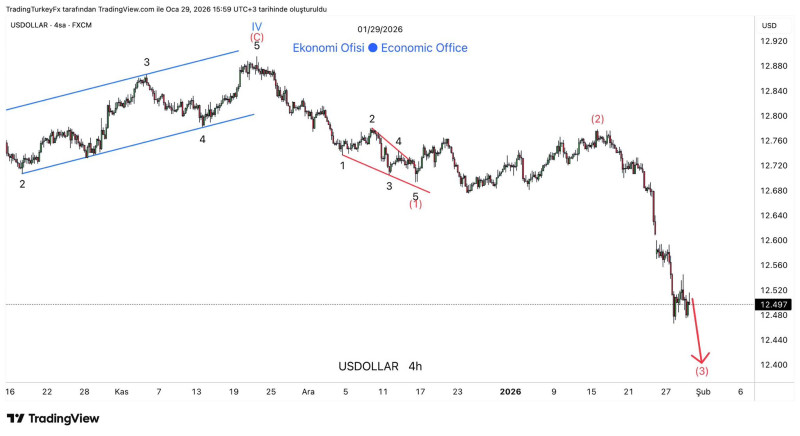
⬤ The chart reveals a clean breakdown from earlier consolidation, with price making lower highs and lower lows throughout recent trading. After topping out near 12.760 earlier in January, USDOLLAR lost steam and reversed hard. The selloff picked up speed heading into late January, with only minor bounces along the way—a sign that bears remain firmly in charge. Elliott Wave analysis on the chart suggests the market is working through a continuation phase rather than just a temporary pullback.
⬤ The 12.560 level has now flipped from support to resistance. Once that floor gave way, downside momentum kicked into higher gear, driving the index toward 12.500. The technical projection on the chart points to 12.400 as the next meaningful target. As long as USDOLLAR stays below broken support and can't reclaim prior structure, the odds favor a push down to that level.
⬤ Dollar Index moves matter across the board—they ripple through currency pairs, commodities, and global risk appetite. Continued weakness in USDOLLAR can shift capital flows and change the strength dynamic in other markets. With the technical trend still pointing down and no clear reversal signals showing up on the 4-hour timeframe, traders are watching to see if the index completes the trip to 12.400 or takes a breather to consolidate before heading lower.
 Yuriy Ukazkin


