
⬤ E-mini S&P 500 futures took a sharp hit during the latest session, pulling back from the 7,030 area after momentum fizzled near record highs. Price is now sitting at a critical support zone, and traders are watching to see if buyers will step in for a reversal. The chart shows a strong bearish move that followed a failed push higher, dropping futures into a demand area that held up before.
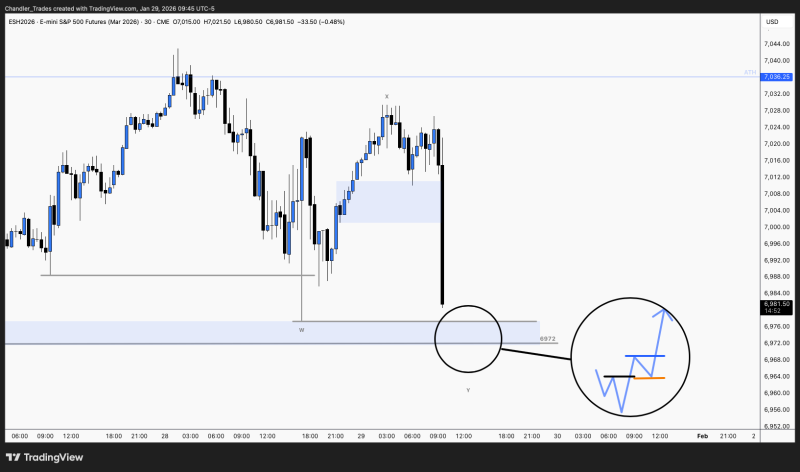
⬤ Futures stalled just below the all-time high before sellers jumped in, breaking through short-term structure and pushing price down to the 6,970 region—a level that's seen reactions and liquidity before. This zone is being watched as a potential spot for stabilization rather than another leg down. No confirmed reversal yet, but price action is starting to slow as it moves into this area.
⬤ The S&P 500 index and SPDR S&P 500 ETF are showing similar short-term weakness while staying within their broader uptrends. The chart's visual projection outlines a scenario where price consolidates, builds higher lows, and rotates back toward recent highs if buyers show up. Until that happens, the market's in correction mode after the breakout attempt failed.
⬤ This support test matters for near-term direction since the S&P 500 is still close to record levels while volatility picks up around key zones. How futures respond here could shape short-term sentiment across U.S. equities. A solid reversal would back up the broader bullish trend, while breaking support could lead to deeper consolidation before the next move takes shape.


