
⬤ Gold continues trading inside a well-established multi-decade rising channel that puts current movements in perspective. Shows that a $1,000 decline from here wouldn't break the broader bullish pattern—on the long-term chart, that kind of move looks relatively minor compared to the overall trend.
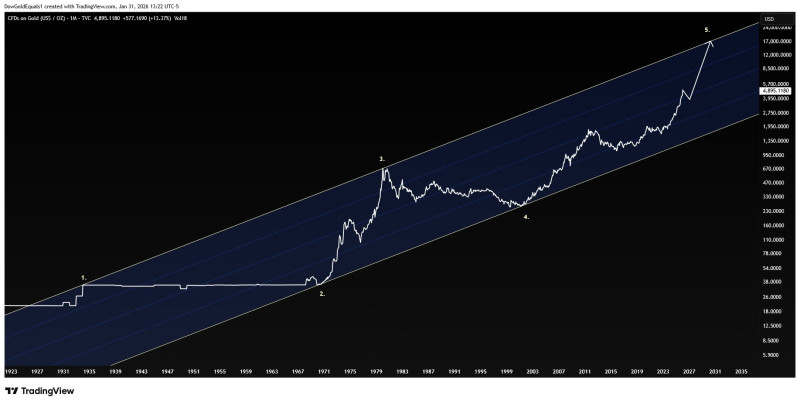
⬤ The historical chart tracking gold since the early 1900s reveals a clear pattern: strong rallies followed by extended cooling-off periods. A pullback toward the channel's middle would be a healthy reset, not a breakdown. Similar-sized drops happened before within this same channel, and each time gold eventually pushed higher once the consolidation finished.
⬤ Gold recently climbed toward the upper edge of its long-term channel, which naturally increases the chances of a correction. "A decline of around $1,000 from current levels could occur without materially altering the broader bullish structure," according to the analysis. While that sounds like a big number, the chart shows it would keep prices comfortably inside the established trend, with the midline historically serving as a spot where momentum pauses before the next leg up.
⬤ This long-range view matters because it frames short-term swings as part of a much larger story. Consolidation around the channel midline could let prices settle while keeping the overall upward path intact. As long as gold stays within this rising channel, the technical outlook toward higher levels near the upper boundary remains valid—even with sharp dips along the way.


