 Dmitri Lysenko

⬤ Gold prices kept climbing aggressively on the hourly timeframe, with XAU/USD locked in a clear parabolic uptrend. Price is pushing against the upper band of a tight ascending channel, showing strong momentum and steady buying pressure. The trend structure looks solid, with Parabolic SAR sitting below price—confirming the bullish trend hasn't cracked yet.
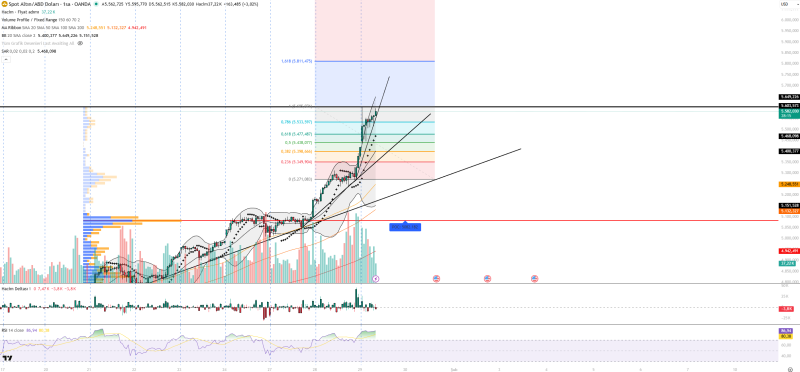
⬤ Technical indicators are now flashing warning signs that this rally might be running too hot. The Relative Strength Index is sitting near 87, putting gold deep in overbought territory and hinting at momentum fatigue. Bollinger Bands show price trading outside the upper band, which means it's stretched beyond normal volatility ranges. Volume is still elevated and confirms strong demand, but volume delta has flipped negative—a sign that profit-taking is starting to emerge near recent highs.
⬤ The chart marks several key levels that could shape what happens next. The Volume Profile Point of Control sits around $5,082, marking an important balance area if a pullback kicks in. Support levels are identified at $5,533, $5,477, $5,439, and $5,350, while resistance zones appear at $5,609, $5,700, $5,811, and $5,950. Despite the stretched conditions, the main trend structure stays bullish—suggesting any correction might come as sideways consolidation or a quick, sharp pullback rather than a full reversal.
⬤ This price action reflects broader market forces driving gold higher. A weaker U.S. dollar, ongoing geopolitical risks, and sustained safe-haven demand are all supporting the move. But rallies this intense often raise the odds of short-term corrections or consolidation phases. How gold behaves near the upper channel boundary and key resistance levels will be crucial for judging near-term momentum and overall sentiment in precious metals.
 Dmitri Lysenko


