 Tatiana Dementieva
⬤ Gold's weekly chart is flashing some interesting signals right now. After a strong, fast move higher, XAU/USD has settled into a consolidation phase near the $4,700 level. The last few candles show a clear shift — momentum has cooled off, and volatility has picked up. Here's the thing: the big story isn't whether gold keeps climbing. It's what happens around the price zones left behind during that sharp rally.
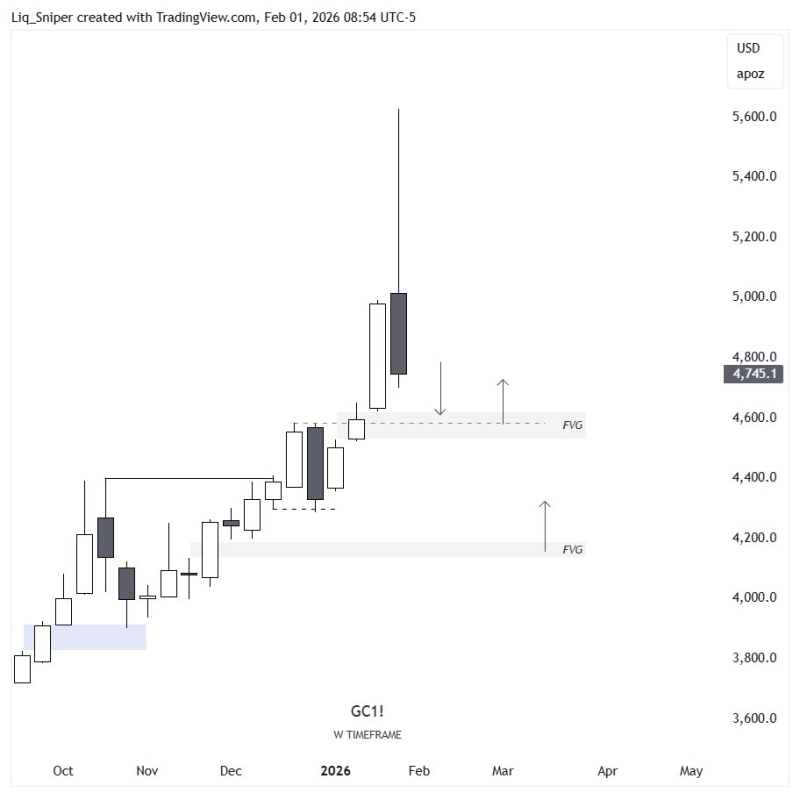
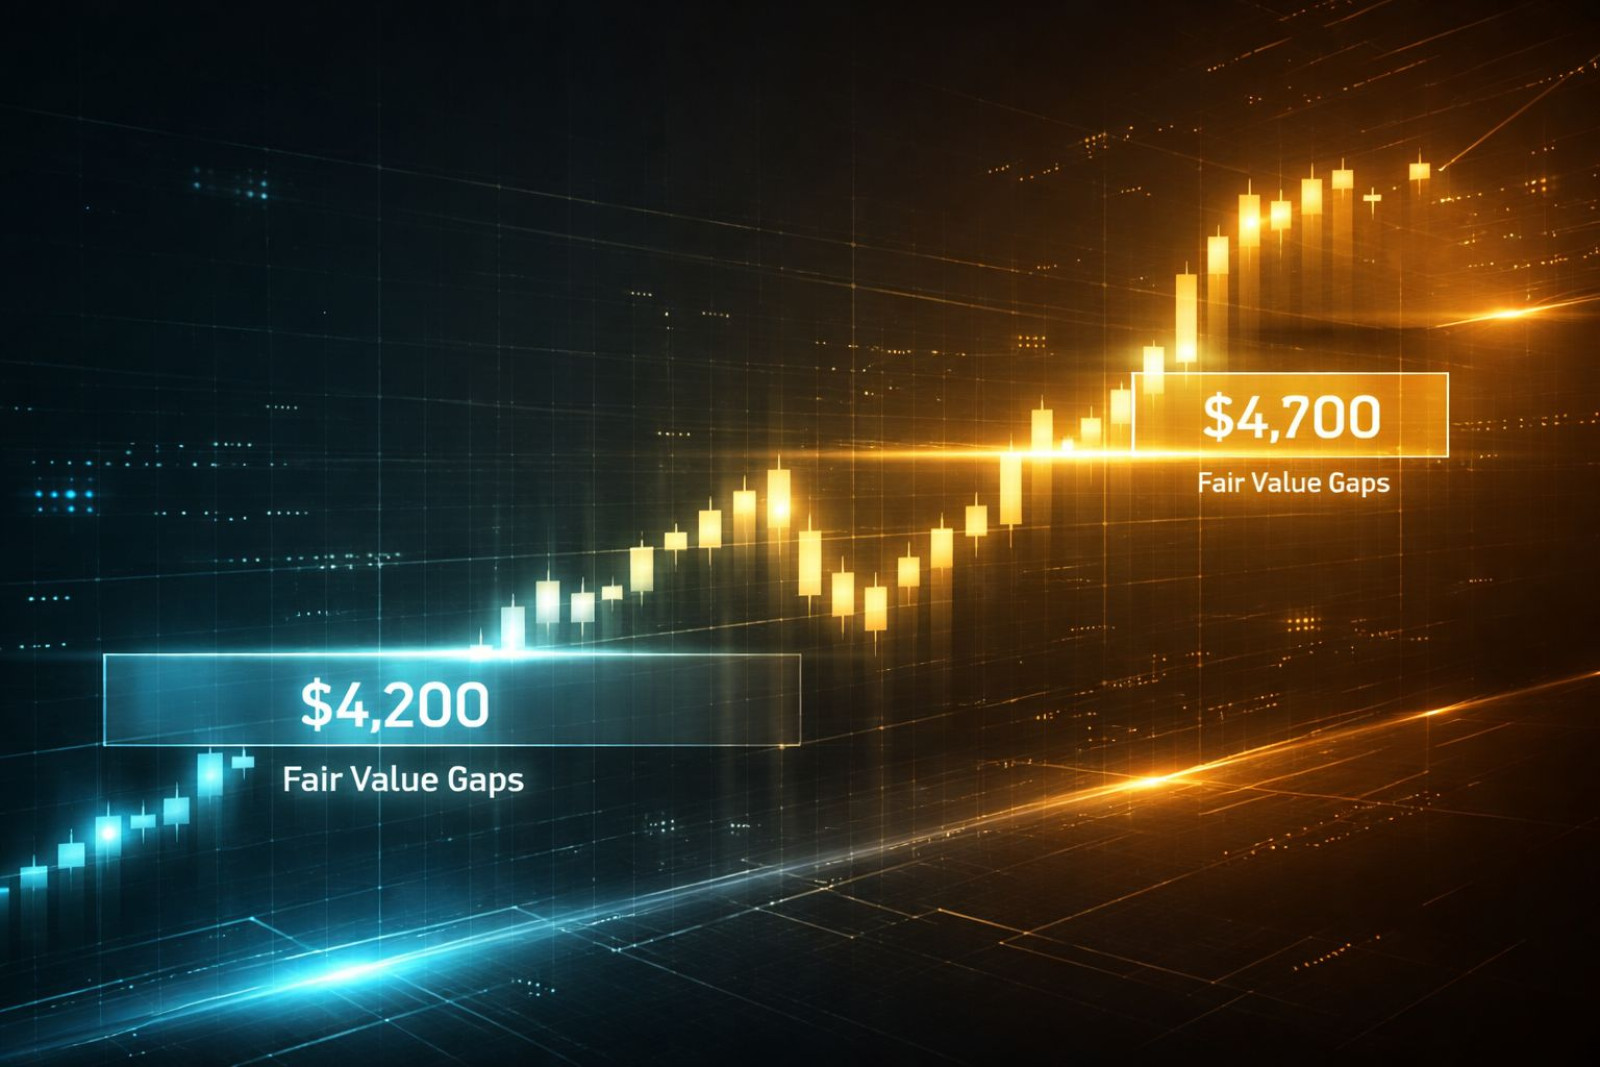
⬤ The weekly structure highlights two unfilled fair value gaps that traders are watching closely. One sits just below where gold is trading now, and a deeper gap stretches down toward the $4,200 region. These gaps tend to act as magnets — price often revisits them to "fill in" the inefficiencies created when markets move too fast in one direction. The most recent weekly candle also shows a long upper wick, which basically says: sellers stepped in and pushed price back down from highs. That rejection matters.
⬤ Heading into early 2026, gold spiked hard before settling into a range above where it was consolidating before. No confirmed trend reversal here — just a pause. The real question is how price behaves around those two fair value gaps. If it holds above them, the bullish structure stays intact. If it dips in to fill them, that could open up a deeper pullback before any further upside.

⬤ Why does this matter beyond the chart? Gold has a habit of moving sharply when broader risk sentiment shifts — and those unfilled gaps on the weekly timeframe suggest the next big leg could be driven by liquidity flows rather than any single piece of news. Watch how XAU/USD reacts around $4,200–$4,700. That range is where the next phase of the gold trend will likely take shape.
 Tatiana Dementieva


