 Alex von Stachelkopf
⬤ Palladium took a beating with a 15% nosedive over just a few hours, plunging from above $115 down into the mid-$90s. The TradingView hourly chart tells the story clearly—long red candles stacking up with barely any breathing room. This wasn't a gradual decline; it was fast, brutal, and relentless.
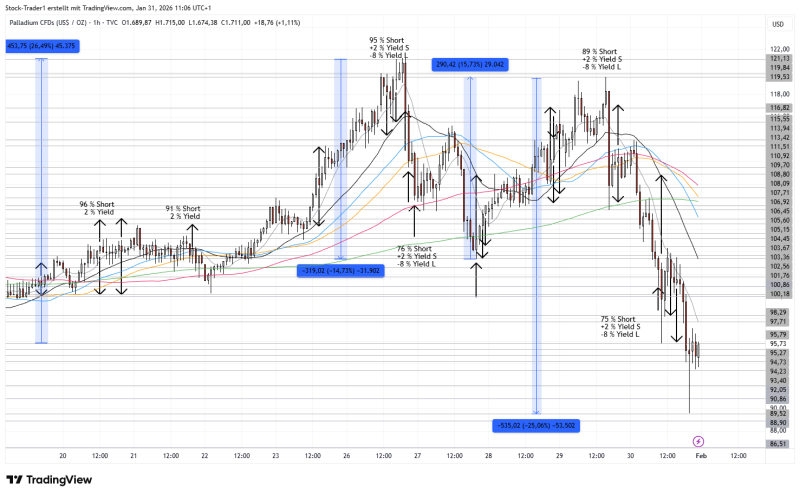
⬤ The collapse happened amid waves of aggressive short positions and layers of stop-sell orders getting triggered one after another. Every time the price tried bouncing back, sellers immediately stomped it down. The chart shows basically no meaningful consolidation—just continuous selling pressure overwhelming any attempts to stabilize.
⬤ After topping out near the $118-$120 range, palladium broke through key moving averages and never looked back. High short exposure zones lit up across the chart as the metal accelerated downward. What really stands out is the complete absence of sustained rebounds—this was clearly forced liquidation and stop-loss chaos rather than normal selling.
⬤ Near the bottom, smaller candles finally started appearing, hinting that the momentum might be slowing. But make no mistake—the damage is done. Price remains buried well below previous support levels, and the entire structure looks deeply bearish following this 15% wipeout.
⬤ This matters because palladium already trades with thinner liquidity than gold or silver. When positioning gets this concentrated, you get explosive moves like this that reshape sentiment instantly. It's a textbook example of how stop-driven flows in a thin market can create massive price swings in minutes.
 Alex von Stachelkopf


