 Nataly Kambur

⬤ Gold (XAU/USD) is starting 2026 on a high note, extending the rally that followed its multi-year breakout. Gold is now positioned to test the $5,000 level after accelerating sharply from earlier consolidation. The long-term chart shows a decisive upward move, confirming the broader bullish trend remains alive and well as the new year gets underway.
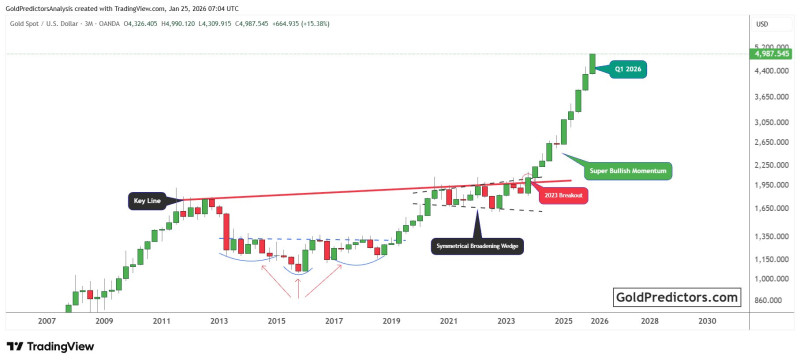
⬤ The chart reveals gold breaking above a major resistance line that had capped price action for over a decade. This 2023 breakout marked a shift from consolidation into a sustained uptrend. Since then, gold has been carving out higher highs and higher lows, with momentum picking up steam heading into 2026. Recent price action shows steep gains rather than slow grinding moves, pointing to strong buying pressure.
⬤ Earlier patterns include a symmetrical broadening wedge and an extended base that formed after the 2011 peak. Both eventually resolved to the upside, reinforcing the long-term bullish outlook. Pullbacks along the way have been shallow, with price consistently finding support above former resistance zones. This suggests dips are being bought quickly without derailing the main trend, keeping gold locked in an upward path as it approaches $5,000.
⬤ Gold's sustained strength matters because it reflects how changing macro conditions are shaping long-term market behavior. Continued momentum at these elevated levels influences sentiment across commodities and related assets, especially with uncertainty still driving flows. As pullbacks hold above key support and the broader structure points higher, gold's performance remains a key indicator to watch as 2026 unfolds.
 Nataly Kambur


