 Nataly Kambur
⬤ Silver has hit a rough patch after weeks of steady gains, dropping into the mid-$80 range following a steep sell-off from recent highs. The five-hour chart shows the metal trading in volatile territory, with technical indicators suggesting a snapback toward the $100 mark could still be in play despite the current turbulence.
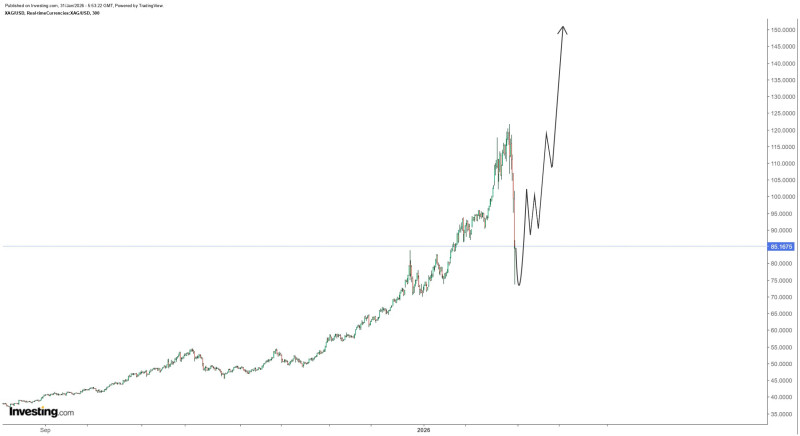
⬤ The bigger picture tells a story of momentum meeting resistance. Silver's chart shows a powerful uptrend that carried into early 2025, then suddenly reversed course. This kind of sharp pullback typically signals profit-taking after prices climb too fast, too soon.
⬤ What happens next could set the tone for the coming weeks. The chart projects a potential recovery toward $100, followed by sideways movement as prices bounce between $95 and $105. This consolidation phase would give the market time to digest the recent volatility and build a foundation for whatever comes next—whether that's another leg higher or further downside.
⬤ The timeline matters here. If support levels hold during consolidation, silver could find fresh momentum heading into late February or early March. For now, the key is watching whether prices can stabilize and reclaim lost ground, or if the pullback signals something more serious for the broader rally.
 Nataly Kambur


