
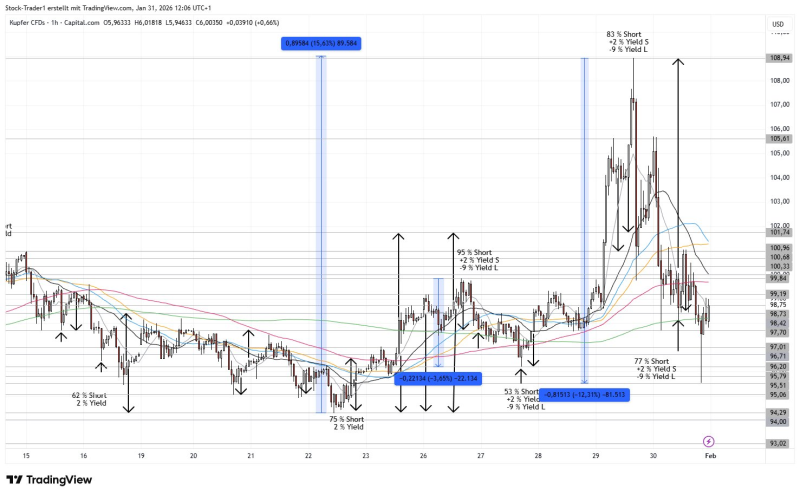
⬤ Copper dropped roughly 5% during recent trading, pulling back sharply after climbing above the 105 level. The metal reversed course and fell back toward the 98-100 range, with the hourly chart showing wild swings and multiple intraday reversals that signal heightened uncertainty.
⬤ Here's what stood out: copper fell far less than gold and silver during the same period. While precious metals got hammered, copper's decline stayed relatively modest—reinforcing that it doesn't behave like a safe-haven asset. Traders are clearly treating it differently, responding more to industrial demand signals than defensive positioning.
⬤ The chart shows heavy action throughout the move. After peaking near 108, copper faced aggressive selling but kept finding buyers on dips. Multiple zones show elevated short positioning followed by quick bounces around key moving averages. It's messy two-way trading rather than a clean trend in either direction.
⬤ Near the lower end of the range, the metal repeatedly tried to stabilize. Each selloff met responsive buying, creating short-term bounces that prevented any sustained collapse. That pattern suggests the market isn't panicking on copper—it's just recalibrating after the recent run-up.
⬤ Why this matters: copper often reflects what traders think about economic activity ahead. Its smaller drop compared to gold and silver shows the market is making distinctions—industrial metals are catching different flows than safe havens. As volatility stays high, watching copper could offer clues about whether risk appetite is genuinely shifting or just taking a breather.


