
⬤ Copper's price action took a turn this week after bouncing strongly from support levels last session. The daily chart showed copper recovering from a dragonfly doji pattern near key support, which triggered a solid move higher and what looked like a breakout attempt. That rally played out as anticipated, rewarding traders who caught the bounce from the lows.
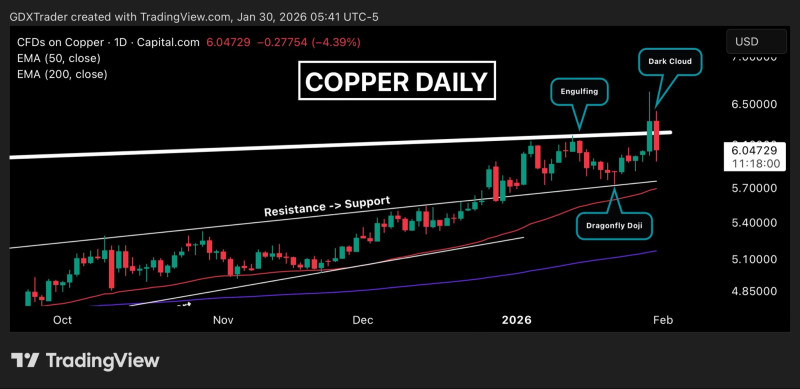
⬤ But the latest session painted a different picture entirely. A dark cloud cover pattern formed—a classic bearish reversal signal that shows up when sellers step in hard after buyers push prices higher. This candle wiped out most of the previous day's gains, showing that resistance overhead is still alive and well. It's a sign that buyers couldn't hold onto the momentum as the week wrapped up.
⬤ Looking at the bigger picture, copper had been climbing within a rising channel, with old resistance levels flipping into short-term support during the rally. Price is still trading above both the 50-day and 200-day moving averages, which continue pointing upward. That's generally positive, but the dark cloud formation suggests the upside momentum has stalled out for now. Copper might need some time to digest recent moves before deciding where it wants to go next.

⬤ Why does this matter? Copper is widely seen as a barometer for industrial demand and economic health. When a breakout attempt fails like this, it tends to shift sentiment across base metals and related stocks. The return of selling pressure shows the market is still split between buyers and sellers, which means we could see choppy, range-bound trading in the near term while participants figure out the next direction.


