 Alex Borzak

⬤ GBP/USD is stabilizing after a textbook correction on the 4-hour timeframe. The pair dropped right into the 0.5–0.618 Fibonacci zone—what traders often call the technical "sweet spot"—and has started reacting positively. The chart shows selling pressure fading after the recent rally, and price is holding steady near mid-1.34 instead of breaking lower.
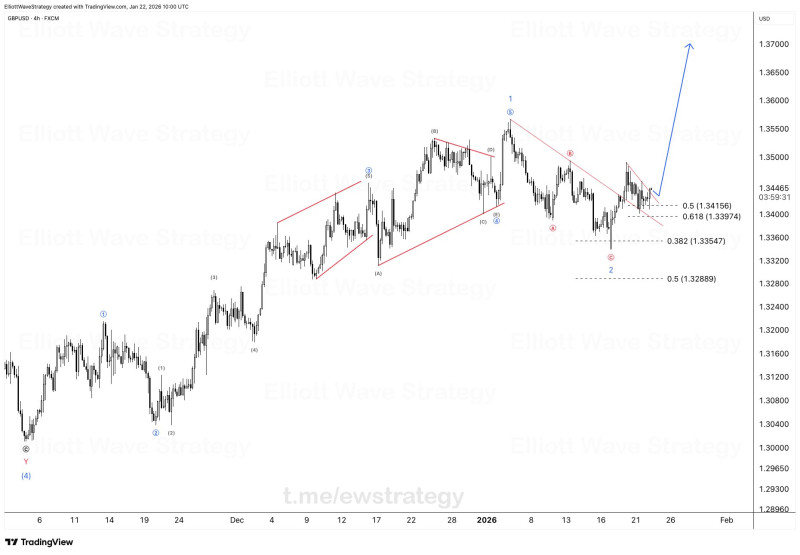
⬤ The structure looks clean from an Elliott Wave perspective: a strong impulse move followed by an orderly correction. After topping out in early January, GBP/USD retraced into the mid-1.34 region, landing squarely on Fibonacci support around 1.3415 and 1.3397. Instead of collapsing through this zone, price respected the levels and began firming up. Trendlines across the pullback show it's been controlled rather than chaotic, which keeps the broader bullish case alive.
⬤ Momentum near this Fibonacci support suggests buyers are stepping in right where they should. There's no lower low on the 4-hour chart, which backs the idea that the corrective wave might be done. The projected path on the chart points higher if price stays above the retracement area. Short-term sideways action is possible, but the bounce from Fibonacci support looks more like a correction ending than a trend dying.
⬤ This setup matters because it shows how clean corrections can clarify what's next during choppy markets. GBP/USD's reaction at the 0.5–0.618 zone proves technical levels still work when multiple factors line up. If price holds this support, the bullish structure stays intact. If it breaks below, the Elliott Wave count fails and the outlook shifts. Right now, GBP/USD is at a fork in the road—what happens next will set the direction for the coming sessions.
 Alex Borzak


