 Nataly Kambur

⬤ Oil has pulled back to a key support area on the M2-adjusted long-term chart—a zone that's been tested multiple times across several decades of market cycles. Price is now squeezed inside a broad downtrend channel that's shaped major turning points going back years. The current level sits right where previous consolidation phases eventually gave way to bigger directional moves.
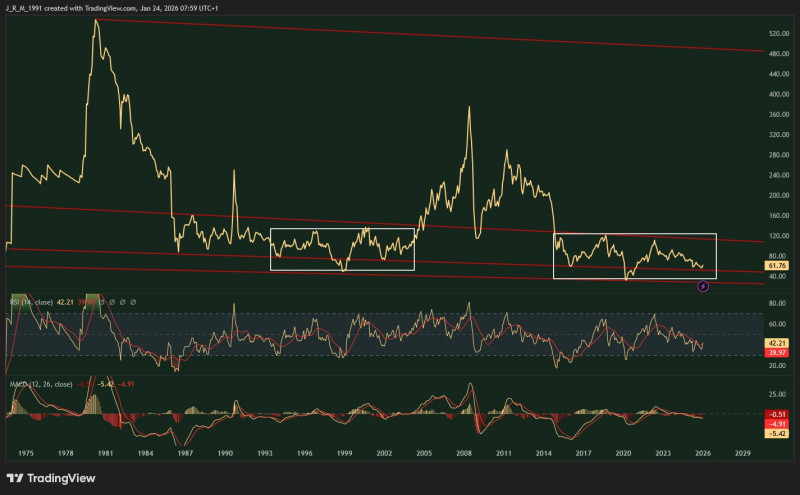
⬤ The M2-adjusted oil price is parked near long-term support that's offered solid risk-reward setups in the past. Earlier touches of this zone happened late in large head-and-shoulders patterns, usually signaling exhaustion rather than the start of deeper selloffs. While price has bounced from this area before, momentum readings show the confirmation signal isn't quite there yet.
⬤ From a technical standpoint, oil is trading along the lower edge of its long-term channel, holding steady despite repeated tests of support. RSI and MACD indicators show muted momentum with no strong push in either direction. The structure looks supportive, but there's no clear catalyst or breakout energy building just yet.
⬤ This matters because oil drives inflation expectations, global liquidity trends, and broader economic cycles. A sustained base at long-term support can shift sentiment across commodities and energy stocks. Momentum may be quiet, but the structural position puts oil at a pivotal spot where downside looks increasingly limited—and what happens next depends on whether momentum finally wakes up or stays flat.
 Nataly Kambur


