 Dmitri Lysenko

⬤ Silver prices jumped at the start of the week, climbing from Friday's close of $102.95 to around $109 on Monday. The monthly chart reveals a 25-year technical pattern showing silver moving within a broad rising channel that's been guiding its price action for decades.
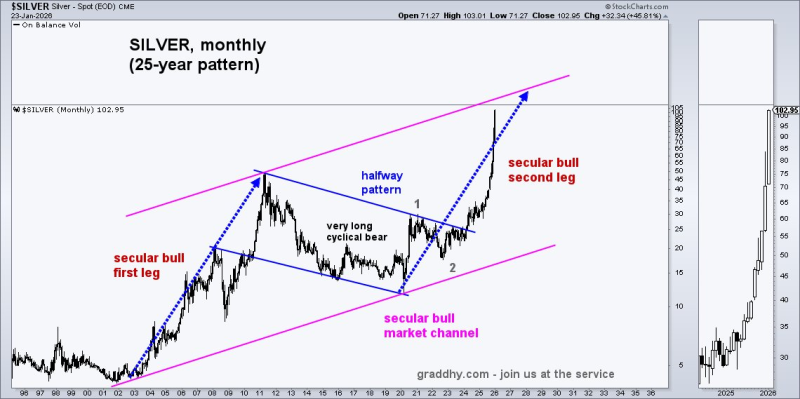
⬤ The chart shows the current rally as part of a secular bull market that's been playing out in phases. The first leg ran through the early 2000s, then gave way to a lengthy bear phase that lasted over a decade. That correction now appears finished, with silver climbing off the channel's lower boundary and entering what looks like the second leg of its long-term bull run.
The recent acceleration places silver on a path toward the upper pink trendline of the 25-year channel, a level that has historically acted as a reference point for extended moves.
⬤ The pattern also highlights a midway consolidation before the current breakout higher. Silver's now heading toward the channel's upper trendline, a historically important level that's marked major turning points in past cycles. The sharp rise reflects strong momentum after breaking out from years of consolidation, with the metal approaching technical zones that have shaped previous market phases.
 Dmitri Lysenko


