
⬤ Silver is now retesting its 2011 peak on an M2-adjusted basis after a sharp rally, marking a pivotal moment for precious metals. The metal is pressing against historically significant resistance that capped prices during the last major bull run. The long-term chart shows price accelerating into the upper resistance zone after years of consolidation.
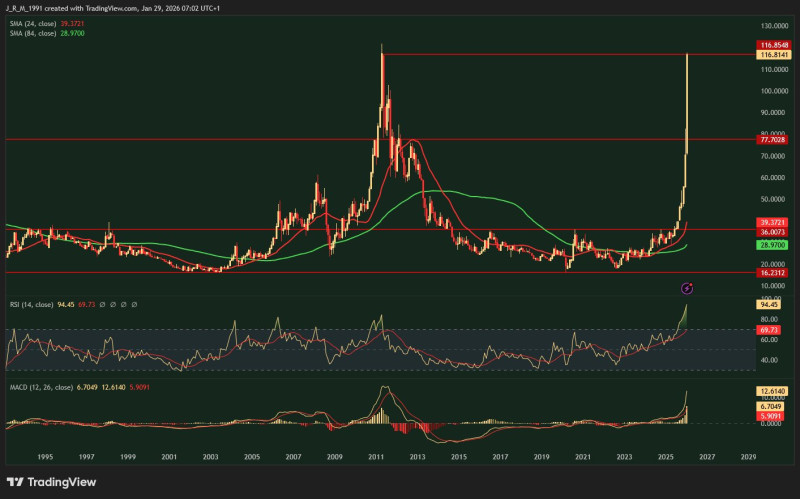
⬤ The technical setup confirms strong momentum behind this move. Silver has broken decisively above long-term moving averages, with price extending well beyond both medium and long-term trend lines. The Relative Strength Index has climbed into extreme territory, signaling intense buying pressure. While these conditions often mark late-stage rallies, they're also typical of powerful breakout phases when major resistance levels are being tested.
⬤ The 2011 peak represents a critical inflection point for silver. That high formed during aggressive monetary expansion and heightened inflation concerns. By adjusting for M2, the current chart directly compares today's price action with that era, underscoring the importance of this retest. A sustained break above the 2011 level would fundamentally shift the long-term structure and raise the odds of a broader secular advance similar to past inflation-driven cycles.
⬤ This matters for the broader market because silver reflects both monetary conditions and demand for real assets. A confirmed breakout above the M2-adjusted 2011 high would validate expectations of continued currency debasement and renewed interest in hard assets. A rejection at this level could trigger consolidation after the extended rally. Either way, silver stands at a crucial crossroads with implications for commodities, inflation expectations, and long-term positioning across markets.


