
⬤ SPY hit a wall during the latest session, posting its biggest daily loss in three months. The ETF closed around 677.6—down roughly 2.0%—after flirting with the 690–695 zone earlier in the day. That sharp reversal carved out a large bearish candle near recent highs, showing just how fast selling pressure can kick in after a sustained run-up.
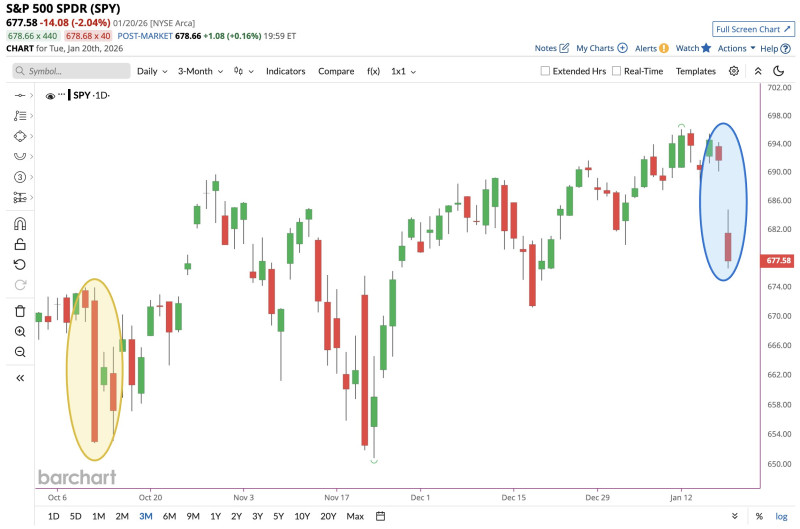
⬤ The drop interrupted a multi-week climb that had pushed prices higher throughout late December and into January. While the three-month chart still shows a pattern of higher lows, this pullback brought SPY back to levels last seen earlier in the month. The chart comparison to October's volatility episode is hard to ignore—back then, a strong advance also gave way to an abrupt retracement, highlighting how extended rallies can set the stage for sudden corrections.
⬤ Post-market data hinted at a modest bounce attempt, suggesting some buyers stepped in after the initial sell-off. Still, it's too early to tell whether that rebound has real legs or if further downside is still on the table. What happens next matters—SPY is a real-time pulse check for U.S. equity sentiment, and large single-day moves like this tend to ripple across volatility gauges, short-term positioning, and risk appetite. Whether the ETF stabilizes here or extends the pullback could set the tone for the market after a strong start to 2025.


