 Nataly Kambur

⬤ The S&P 500 index started pulling back after failing to hold recent highs, with SPX turning lower near the upper boundary of a rising channel on the daily chart. Price briefly traded above 7,000 before reversing, signaling exhaustion after a strong multi-month advance. The rejection happened close to a clearly defined resistance band, showing sellers are starting to take control after the extended run.
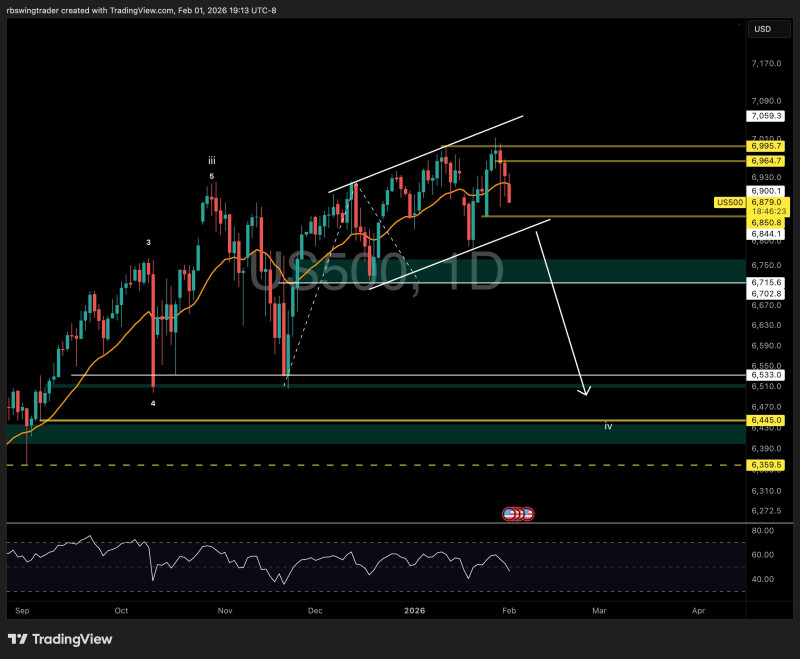
⬤ Attention has shifted toward the potential for a controlled dip rather than continued upside acceleration. The chart shows multiple resistance levels clustered between 6,965 and 6,995, where upside attempts have repeatedly stalled. Following the rejection, SPX slipped back toward 6,880–6,900, showing weakening short-term momentum. The rising channel structure stays intact, but current price action favors a move toward its lower boundary.
⬤ The chart outlines several downside reference zones if the pullback continues. Initial support sits near 6,715–6,750, corresponding with a prior consolidation area. Below that, a broader demand zone appears closer to 6,445, marked as a deeper corrective level. These areas align with previous reactions, suggesting they could attract attention if selling pressure builds. Momentum indicators have also turned lower from elevated levels, reinforcing the cooling trend.
⬤ This matters for overall market conditions because the S&P 500 often sets the tone for broader equity sentiment. A measured pullback would represent a technical reset after a sustained rally, potentially helping stabilize conditions. However, failure to hold the first support zone could increase volatility and deepen the correction. With SPX reacting at well-defined resistance, focus remains on whether the index can stabilize on the dip or extend lower toward the next support levels ahead.
 Nataly Kambur


