
⬤ The S&P 500 (SPX) is currently trading near the upper boundary of a multi-year ascending channel on the weekly chart. The visualization shows just how far the index could potentially fall while still remaining within its long-term uptrend structure.
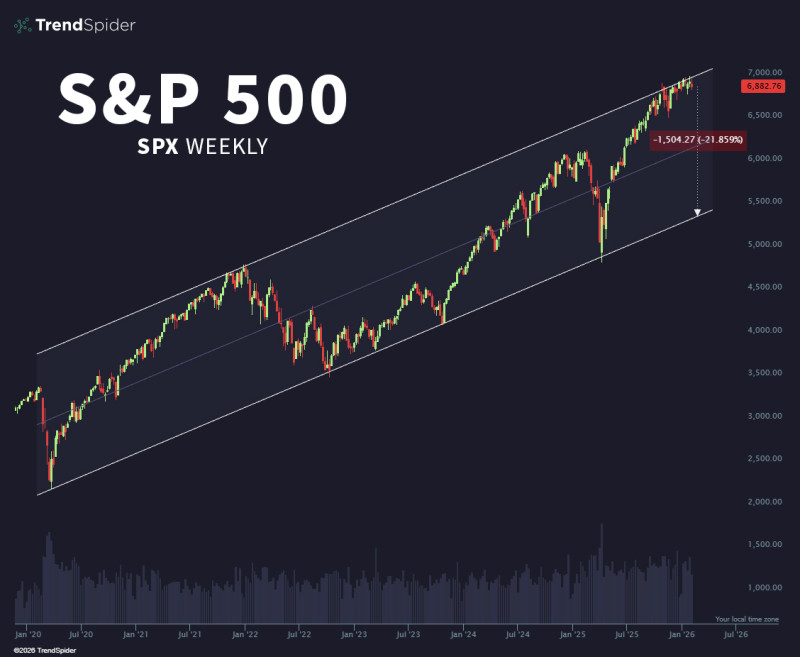
⬤ Right now, SPX sits around 6,882 near channel resistance. The lower boundary of this channel is positioned significantly below current levels. If the index were to move from the upper edge down to the lower trendline, we'd be looking at roughly a 1,504-point decline—that's about 21.85%—while technically still staying within the broader upward channel.
⬤ History shows that the index can experience large pullbacks without breaking its overall trend. Previous movements inside this channel demonstrate that substantial corrections can happen during long-term advances without necessarily signaling a confirmed reversal.
⬤ What this scenario really emphasizes is the potential scale of volatility within an ongoing uptrend. Even inside an established upward structure, SPX corrections can be substantial, which shapes expectations about market swings and risk conditions across the broader market.


