 Serj Panchuk

⬤ U.S. equity markets are staying under pressure as S&P 500 E-Mini March 2026 futures keep sliding on the daily chart. ESH26 is trading around 6,890 right now, down about 1.1 percent for the session. This puts the index on pace for a fourth straight red day—something we haven't seen much of lately.
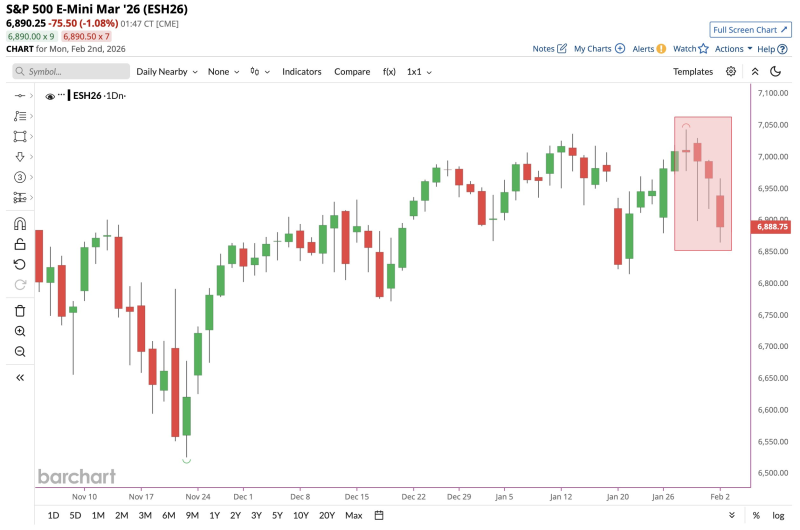
⬤ The daily chart shows a clear rejection happening in the 7,000 to 7,050 zone, where buyers just couldn't keep pushing higher. Instead of one big sell-off, we're seeing several red candles stacking up, which tells us sellers are in control and this isn't just a quick shakeout. That rejection area on the chart marks where the bulls threw in the towel and bears took over.
⬤ Even with this pullback, the broader picture is still holding inside the range we've been stuck in since late 2025. Before this recent drop, the S&P 500 E-Mini had a solid rally from December lows and hit fresh highs in January. These consecutive down days look more like consolidation and profit-taking than an actual trend change. Price is still sitting well above the November and December support levels, so the bigger structure hasn't broken down yet.

⬤ Four straight losing sessions tend to mess with short-term sentiment and volatility expectations. Traders are getting more sensitive to incoming macro data and earnings reports, especially if this downside momentum keeps going. The S&P 500 E-Mini hasn't cracked any major support yet, but more selling would definitely signal a shift in near-term momentum. With price trading below recent highs, everyone's watching to see if this selling pressure calms down or pushes toward deeper support zones in the next few sessions.
 Serj Panchuk


