
⬤ The U.S. Dollar Index just hit a major turning point after slipping below an ascending channel that held for over a decade on the quarterly chart. The breakdown shows DXY falling through the lower boundary of that rising structure, marking a clear shift from the uptrend that's been in place since the early 2010s. This isn't just a routine dip—it's a signal that the long-term momentum may be changing.
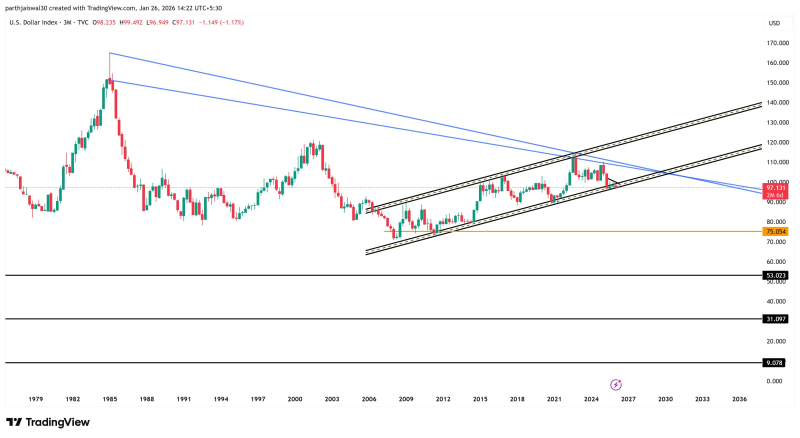
⬤ DXY is now trading in the mid-to-high 90s after losing support from the channel. The chart shows several historical reference levels sitting way below current price: around 75, 53, 31, and 9. These aren't immediate targets—they're deep support zones from past cycles that only come into play if this breakdown turns into something bigger over the next few quarters. The quarterly timeframe means we're looking at a long-term story, not a quick reversal.

⬤ What makes this breakdown more significant is how the index failed to reclaim the upper resistance lines from earlier peaks. Recent candles confirm sustained weakness below what used to be reliable support. When a multi-year pattern of higher highs and higher lows breaks down on the quarterly chart, it usually leads to months or even years of trend reassessment rather than a quick bounce back.
⬤ This matters beyond just dollar watchers. DXY movements ripple through currencies, commodities, and capital flows worldwide. A sustained drop below long-term support typically lifts assets like gold and silver while reshaping macro sentiment across global markets. With the index now sitting below its former structural floor, the focus shifts to whether this breakdown evolves into a full trend reversal or finds support at one of those historical zones marked on the chart.


