
⬤ The US Dollar Index experienced a sharp technical reversal after failing to hold its recent breakout. The weekly chart shows DXY turning lower with a full bearish engulfing candle that wiped out the previous three weeks of gains. This reversal was followed by a rare weekly gap down, signaling a potential shift in the broader trend.
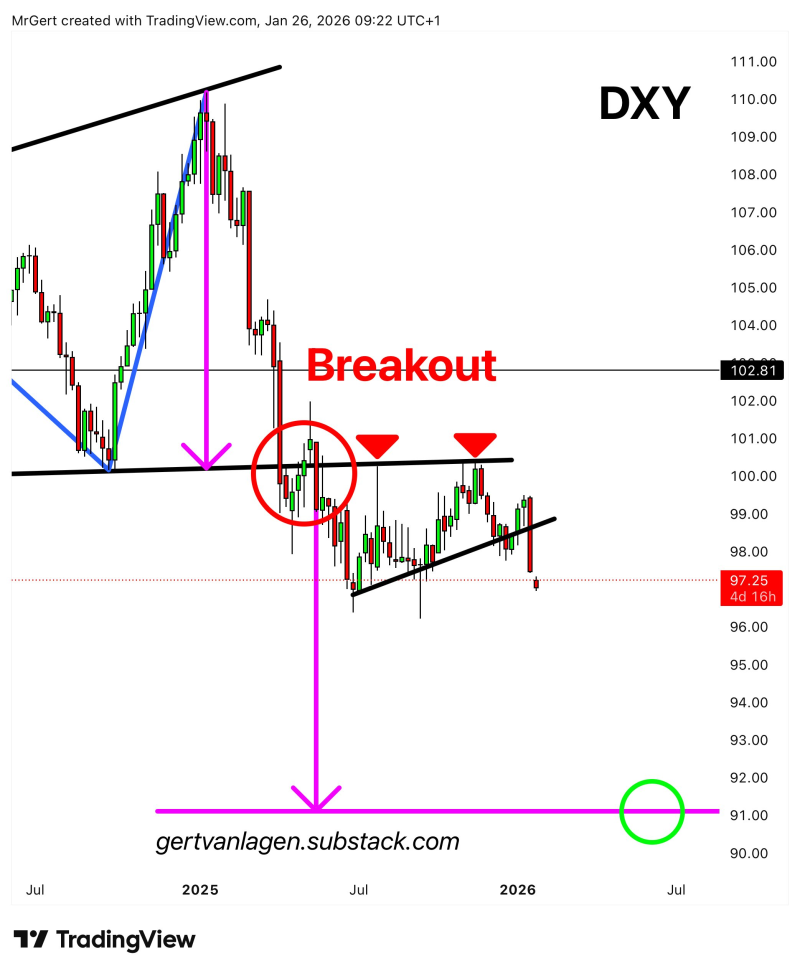
⬤ After briefly pushing above the 102.8 resistance zone, DXY lost momentum and dropped back below former support. This failed breakout triggered accelerated selling, with limited recovery attempts in subsequent sessions. Former support has now flipped to resistance, reinforcing the bearish setup.
⬤ The chart identifies a longer-term reference zone near 91, based on historical structure. Current price action around 97 shows continued weakness following the breakdown. The combination of bearish engulfing pattern, weekly gap, and broken support creates a technical configuration rarely seen outside of significant trend reversals.
⬤ This matters for global markets because DXY movements influence currencies, commodities, and risk assets. A sustained dollar decline can shift relative asset performance and reshape market sentiment. The current setup shows how rapid dollar reversals often coincide with heightened volatility and repositioning across global markets.


