 Dmitri Lysenko
⬤ GBP/USD is currently trading above the 88.6% Fibonacci retracement from its recent decline, showing strength during European hours. The pair has been holding above previous support areas, suggesting buyers are still engaged at these levels. Price action has stabilized above this technical marker while maintaining the recovery pattern that's been building since late 2025.
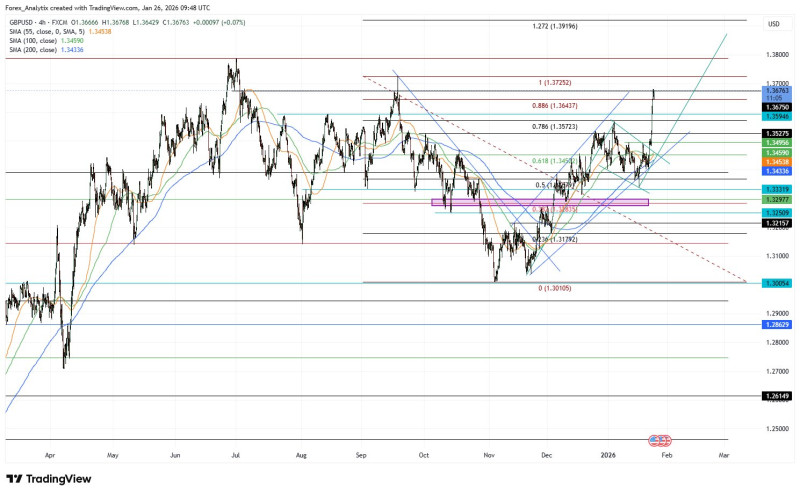
⬤ The spotlight is now on the 1.3725 to 1.3785–1.3790 range, which represents the next upside target if the rally continues. This zone lines up with several resistance points, including previous highs and Fibonacci projections from the recent move higher. As one analyst noted, "Price approaching this zone may encounter increased selling interest, making it a key reference area for short-term market direction."
⬤ If the pair pulls back, the first support to watch sits around 1.3640 to 1.3645—an area that previously acted as resistance and now serves as near-term support. A deeper retracement could bring 1.3570 to 1.3590 into play, which matches up with lower Fibonacci levels and trendline support from the recent recovery.
⬤ These levels matter because GBP/USD is approaching zones where momentum typically gets tested. Staying above the support areas would keep the recovery intact, while breaking below might trigger consolidation or a correction. With price sandwiched between well-defined resistance and support, how it behaves around these levels will likely set the tone for upcoming sessions.
 Dmitri Lysenko


