 Alex Bobrov
⬤ The Dollar Index has stalled out after bouncing from its January 28 low, and the price action shows it's now sitting at a critical technical spot. DXY reached a high-frequency zone that analysts flagged recently, and now everyone's watching to see if it can push higher or if the pullback continues. The chart shows this hesitation playing out in real-time.
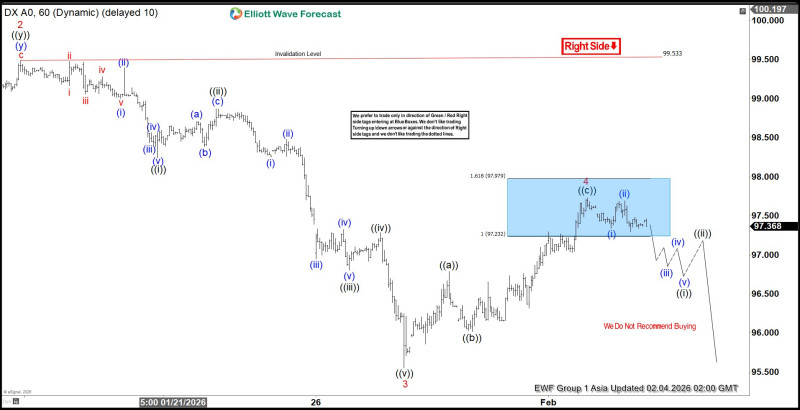
⬤ Looking at the Elliott Wave setup, this recent climb looks more like a temporary bounce than the start of any real rally. The chart marks a clear resistance zone above where we are now, and the wave structure suggests there's not much gas left in the tank for moving higher. As long as DXY stays under 99.5, the door remains open for more downside.
⬤ That 99.5 level is the line in the sand right now. Below it, and the index could keep sliding. The chart points to potential weakness ahead if DXY can't reclaim higher ground soon.
⬤ This matters because the Dollar Index drives sentiment across currency markets and impacts everything priced in dollars. If it keeps trading below 99.5, expect the corrective move to continue. But if it breaks back above, the whole picture changes. How DXY handles this level will set the tone for forex traders in the near term.
 Alex Bobrov


